|
helpful government
links...
 Thomas:
For Every Bill, Every Time, Call Tom: http://thomas.loc.gov Thomas:
For Every Bill, Every Time, Call Tom: http://thomas.loc.gov
government
printing office:
http://www.gpoaccess.gov/index.html
library
of congress:
http://lcweb.loc.gov/
200 Independence Avenue, SW (DHHS):
http://www.hhs.gov/
CM2 (the agency formerly known as HCFA):
http://www.cms.hhs.gov/default.asp?
national committee on vital and health statistics (NCVHS):
http://www.ncvhs.hhs.gov/
congressional budget office (CBO):
http://www.cbo.gov/
 agency for health care research and quality (AHRQ):
http://www.ahrq.gov/ (the little
agency that could and a key agency for the future of US health care
reform)
agency for health care research and quality (AHRQ):
http://www.ahrq.gov/ (the little
agency that could and a key agency for the future of US health care
reform)
helpful association
links...
 WEDi: http://www.wedi.org/
 american health information management association (AHIMA):
http://www.ahima.org/ american health information management association (AHIMA):
http://www.ahima.org/
 healthcare information management systems society (HIMSS):
http://www.himss.org/ASP/index.asp healthcare information management systems society (HIMSS):
http://www.himss.org/ASP/index.asp
helpful ppaca, hipaa and
other health care information technology links...
 building a health
information technology foundation for health reform: a look at recent
guidance and funding opportunities: http://www.kff.org/healthreform/8132.cfm building a health
information technology foundation for health reform: a look at recent
guidance and funding opportunities: http://www.kff.org/healthreform/8132.cfm
an
introductory resource guide for implementing the hipaa security rule:
http://csrc.nist.gov/publications/drafts/DRAFT-sp800-66.pdf
about
the international classification of diseases, tenth edition, clinical
modification:
http://www.cdc.gov/nchs/about/otheract/icd9/abticd10.htm
pre-release, ICD-10-CM:
http://www.cdc.gov/nchs/about/otheract/icd9/icd10cm.htm
thoughtful jeanne
scott links…
the
health care blog:
http://www.thehealthcareblog.com/
wye
river group on healthcare:
http://www.wrgh.org/index.asp
the commonwealth
fund: http://www.cmwf.org/
funny jeanne scott links…
mark
fiore:
http://www.markfiore.com/
political strikes:
http://www.politicalstrikes.com/
will durst:
http://www.willdurst.com/
other helpful
documents, reports, studies and web sites…
(1)
...the Canonical list.
http://www.health-politics.com/resource.html#canon
(2)
... PPACA
Acronyms and Glossary.
http://www.health-politics.com/resource.html#acronym
(3) ...
PPACA Seeks to Simplify Health Insurance
Forms and Help Consumers Make Better Choices.
http://www.health-politics.com/resource.html#forms
(4)
... Toward a Shared Vision of Payment Reform: A Commonwealth Fund White
Paper
http://www.commonwealthfund.org/~/media/Files/Publications/Other/2011/Shared_vision_payment_reform.pdf

(5)
...
Repealing Health Reform’s Maintenance of Effort Provision Could Cause
Millions of Children, Parents, Seniors, and People With Disabilities to
Lose Coverage ... Repeal Would Also Cause Loss of Jobs
http://www.cbpp.org/cms/index.cfm?fa=view&id=3397

(1) ...the Canonical list...
National Resources
HealthCare.gov
 This
new website developed by the U.S. Department of Health and Human
Services helps you understand all the health insurance options available
in your local area for you and your family. After answering just a few
basic questions, the website's insurance finder will identify public and
private coverage options that might be right for you. You can receive
updates on the implementation of the new law and, as the website grows,
you will be able to research health plan quality ratings, learn about
disease prevention, and compare health plan prices all in one place. This
new website developed by the U.S. Department of Health and Human
Services helps you understand all the health insurance options available
in your local area for you and your family. After answering just a few
basic questions, the website's insurance finder will identify public and
private coverage options that might be right for you. You can receive
updates on the implementation of the new law and, as the website grows,
you will be able to research health plan quality ratings, learn about
disease prevention, and compare health plan prices all in one place.
Health Reform
GPS
 RWJF and George Washington University have just
launched this new web-based platform that will serve as a high-level
guide to the health reform implementation process. The purpose of the
site is to open a window into the role and activities of the federal
agencies responsible for spearheading implementation and to attract
commentary on the endless array of policy questions that will inevitably
arise along the way. RWJF and George Washington University have just
launched this new web-based platform that will serve as a high-level
guide to the health reform implementation process. The purpose of the
site is to open a window into the role and activities of the federal
agencies responsible for spearheading implementation and to attract
commentary on the endless array of policy questions that will inevitably
arise along the way.
Closing the
Prescription Drug Coverage Gap
The Patient Protection and Affordable Care Act
("PPACA") passed and signed this year
contains some important benefits for Medicare recipients, including drug
benefits explained in this brochure. The $250 doughnut hole rebate is
the first step toward closing the Medicare prescription drug coverage
gap. If you reach the coverage gap in 2011, you will get a 50% discount
on your brand name prescription drugs at the time you buy them, unless
you are already getting Medicare Extra Help. Help
spread the word about this important benefit. And help stop scams
against seniors. Pass this brochure along to your friends, neighbors.
How Health Reform Helps the States
Families USA's state-specific one-page fact sheets designed for
advocates to use in their communities. Please customize these with your
own logo and contact information. (May 2010)
Health Reform: Why We Should
Celebrate
 Families USA's PowerPoint presentation based on their piece, Help Is On
the Way: 12 Reasons to Embrace Health Reform. This is a simple and clear
tool that can be used to educate the public on the many ways that they
will benefit from the new law. It includes talking points, but we
encourage advocates to tailor the presentation to their audience. (May
2010) Families USA's PowerPoint presentation based on their piece, Help Is On
the Way: 12 Reasons to Embrace Health Reform. This is a simple and clear
tool that can be used to educate the public on the many ways that they
will benefit from the new law. It includes talking points, but we
encourage advocates to tailor the presentation to their audience. (May
2010)
Help Is On the Way: 12 Reasons to
Embrace Health Reform
Families USA's overview piece that discusses 12 key improvements in the
health reform law, which will benefit millions of Americans and their
families. (May 2010)
12 Reasons Campaign
Families USA's campaign launched on their microsite,
www.standupforhealthcare.org. Includes a blog post for each of the
12 reasons, showing how American families and businesses will be helped
by the new law. Please feel free to cross-post or share these blogs with
your social media networks—a quick and easy way to spread the word! (May
2010)
Roadblocks to Implementation
section of
Health Reform Central
Families USA has added updates on repeal/nullification efforts, advice
on how to respond to attacks, and legal arguments against
repeal/nullification. (May 2010)
What Will Happen Under Health
Reform—And What's Next?
 Newly enacted national health reform will begin, almost immediately, to
transform the U.S. health care system in ways large and small. The
changes will increase the number of people with health insurance, and
affect how many of us obtain coverage, how care is paid for and
delivered, and how it is regulated. Commonwealth Fund answers key
questions about health reform for journalists and others and provides a
timeline of reform milestones. Newly enacted national health reform will begin, almost immediately, to
transform the U.S. health care system in ways large and small. The
changes will increase the number of people with health insurance, and
affect how many of us obtain coverage, how care is paid for and
delivered, and how it is regulated. Commonwealth Fund answers key
questions about health reform for journalists and others and provides a
timeline of reform milestones.
Health Reform Law and Young Adults
Briefing Video/Podcast
 Almost 14 million people between the ages of 19 and 29 were uninsured in
2008. The new health reform law requires insurers to allow dependent
children to remain on their parents' plans until age 26. But many
questions remain. On May 24, an Alliance for Health Reform/Commonwealth
Fund briefing in Washington, D.C., explored how the law affects young
people. A video and podcast of the briefing, courtesy of the Kaiser
Family Foundation, are available. Resource materials are also available
and a transcript from the briefing will be posted soon. Almost 14 million people between the ages of 19 and 29 were uninsured in
2008. The new health reform law requires insurers to allow dependent
children to remain on their parents' plans until age 26. But many
questions remain. On May 24, an Alliance for Health Reform/Commonwealth
Fund briefing in Washington, D.C., explored how the law affects young
people. A video and podcast of the briefing, courtesy of the Kaiser
Family Foundation, are available. Resource materials are also available
and a transcript from the briefing will be posted soon.
New Briefing on Payment Innovation:
What Lies Ahead Under Health Reform?
The health reform law will make several changes in the way health care
is paid for, particularly in public programs. A May 10 briefing
sponsored by the Alliance for Health Reform and The Commonwealth Fund,
"Pathways to Payment Innovation in a Post-Health Reform Era," explored
the major payment initiatives in the new law and their potential
effects. It explored such questions as: What role can payment changes
play in moving health care away from the fee-for-service system toward
value-based reimbursements? What can be learned from earlier public and
private efforts to better align payment incentives with program goals?
How will the new Center for Medicare and Medicaid Innovation work to
test new approaches, and then scale up the successful ones?
Presentations and other resources from the briefing are available on the
Alliance for Health Reform
Web site, and a webcast and podcast of the event are available on
the Kaiser Family Foundation's
site.
Cover the Uninsured Health Care Reform Implementation
Resources – Website, Events Help, Twitter
Now
that health care reform has been signed into law, health care coverage
will be available to an additional 32 million uninsured Americans. This
legislation is a historic milestone that addresses many of the key areas
Cover the Uninsured organizers have been fighting for across the
country. You can
read more
about how health reform will impact your community on the Cover the
Uninsured website. Now is the time to host
enrollment events
to make sure eligible adults and kids get the low-cost or free coverage
they need through programs that are already available in your community.
You may also want to review the
Community Forum Guide
to engage community members and educate them on the changes that will be
implemented in your area. Cover the Uninsured will also keep you
up-to-date with e-mails and our
Twitter
feed.
Families USA Health Reform Implementation Central
As
health advocates, it’s important to make sure that the new law is
implemented effectively and in the most consumer-friendly way. Families
USA has created a new micro site,
Health Reform Central, which is designed to support you in
implementing all of the new protections and opportunities that health
reform will bring to your state. A few highlights include:
Understanding the new law; Repeal
efforts; and an
Interactive state page.
Seniors Worry About Medicare Reforms, Especially Changes To Medicare
Advantage
"While Democrats hail the sweeping legislation as the greatest expansion
of the social safety net since Medicare, they also fear that seniors
won't see it that way for this fall's elections. Indeed, Republicans
have portrayed the overhaul as a raid on Medicare - a bedrock of
retirement security - to provide money to pay for covering younger,
uninsured workers and their families. An Associated Press-GfK survey in
March found that 54 percent of seniors opposed the legislation that was
then taking final shape in Congress, compared with 36 percent of people
age 18-50. And last week a USA Today/Gallup Poll found that a majority
of seniors said passing the bill was a bad thing - while younger people
were positive about it. (4/1/2010, AP)
 "Despite the central role that the individual mandate
plays in health care reform, proposals have been introduced in over 35
state legislatures to prevent the individual mandate from taking effect.
In addition, two lawsuits have been filed to challenge the individual
mandate? [Such s]tate nullification efforts almost certainly will be
unsuccessful in invalidating the new federal law. But efforts to nullify
the individual mandate could weaken political support for health reform
and make successful implementation at both the state and federal levels
more difficult to achieve." (4/7/10, CBPP) "Despite the central role that the individual mandate
plays in health care reform, proposals have been introduced in over 35
state legislatures to prevent the individual mandate from taking effect.
In addition, two lawsuits have been filed to challenge the individual
mandate? [Such s]tate nullification efforts almost certainly will be
unsuccessful in invalidating the new federal law. But efforts to nullify
the individual mandate could weaken political support for health reform
and make successful implementation at both the state and federal levels
more difficult to achieve." (4/7/10, CBPP)
New Health Initiatives Put Spotlight
On Prevention
Amid all the rancor leading up to passage of the new health care law,
Congress with little fanfare approved a set of wide-ranging public
initiatives to prevent disease and encourage healthy behavior. (4/10/10,
NYT)
Health Care Opinion Leaders: New Law
Will Provide Millions with Access to Affordable Coverage
By an overwhelming majority, leaders in health care and health policy
think the new health care reform law will successfully expand access to
affordable health insurance to the millions of Americans who currently
go without it. The latest
Commonwealth Fund/Modern Healthcare
Health Care Opinion Leaders survey—
which was fielded
while the legislation was still pending in Congress—also found that
virtually all key features of the health reform law are supported by a
large majority of opinion leaders. (April 2010, Commonwealth Fund)
Online Resources
For Information On Health-Care Reform
The ink was hardly dry on the health-care overhaul law when foundations,
industry groups and consumer advocates began putting together guides to
the new rules. (4/6/10, Washington Post)
"Some opponents of health reform argue that
the new law’s individual mandate — the requirement that individuals must
have health coverage or face a penalty — should be repealed but the
law’s most popular insurance market reforms kept in place. These reforms
will bar insurers from denying coverage to people with pre-existing
conditions, charging higher premiums based on a person’s health status
or gender, or placing annual or lifetime caps on covered benefits. This
approach would be doomed to fail. An individual mandate is essential to
the success of insurance market reforms and to keeping premiums
affordable" (4/7/10, CBPP)
REPORTS AND
STUDIES
Health Insurance Exchanges and the Affordable Care Act:
Key Policy Issues
examines 13 critical issues that federal and state
authorities must resolve if the new exchanges are to succeed: Ensuring
that exchanges don't become victims of "adverse selection"; Enrolling
enough individuals in exchanges to achieve sufficient market power,
economies of scale, and risk pool stability; Offering consumers choice
without complexity; Maximizing transparency and disclosure—one of the
most important tasks in the implementation process; Encouraging
competition among insurers on value and price. Keeping down
administrative costs of exchanges, as well as those of insurers and
employers; Establishing strong relationships between exchanges and
employers. (7/15/10, Commonwealth Fund)
'Loss Ratio' Debate Proves Again That
Rulemaking Is as Hard as Lawmaking
Democrats outraged by insurance company profits designed
a piece of the new health care law to force insurers to direct most
premium money toward benefits. The law requires that, beginning in 2011,
large group plans spend 85 percent of premiums on clinical services and
activities related to quality of care. Only 15 percent can go to other
items, such as administrative costs, advertising and profits. For small
group and individual plans, it's 80 percent premiums and 20 percent
other costs. The law was otherwise fairly vague about what counts as
medical claims and what counts as administrative costs. For insurers,
the stakes are high because the decision could directly—and in some
cases adversely—affect companies' profits.
(6/25/10, CQ HealthBeat)
Implications Of Health Reform For
The Medical Technology Industry
The changes included in health reform include both positives and
negatives for the [medical technology] industry, but, on balance, the
industry is likely to thrive in the new era. However, the protection of
innovation is a crucial issue for both the industry and current and
future patients, who depend on medical progress for longer and healthier
lives (7/9/10, Health Affairs)
Loophole may let `mini-med' health insurance policies off the hook
The low annual payout limits on skimpy health
plans, including the state's own ``Cover Florida'' program, are supposed
to go away in September under new federal rules released this week. But
a close reading of the rules shows some wiggle room. (6/24/10,
Miami Herald)
HHS Estimates 200,000 to Gain Coverage Via 'Pre-Existing Condition
Insurance Plan'
Americans who have been uninsured for at least six months
and have been unable to obtain private health coverage because of a
pre-existing health condition can now apply for benefits through a new
program created by the health care overhaul law, the department of
Health and Human Services announced. (7/6/10,
Commonwealth Fund)
Web Site Launched to Help Consumers Find Plans—But May Quickly Become
Focal Point of New Law
The federal government went live with a much ballyhooed
Web site that helps consumers find health insurance options and explains
benefits under the new health care overhaul law. (7/6/10,
Commonwealth Fund)
New Coverage for Uninsured People in Poor Health
The Obama administration is launching a special coverage program for
uninsured Americans with medical problems this week, the most ambitious
early investment of President Barack Obama's health care overhaul.
(6/30/10, AP)
Medicare Changes Could Shortchange Vulnerable Hospitals
The U.S. government's plan to base Medicare payments to hospitals on
certain quality-of-care measures could end up transferring funds away
from hospitals in the nation's poorest, underserved areas, an analysis
published Tuesday suggests. (6/29/10, Reuters)
Pressure Rising on Healthcare Long Before Overhaul Takes Effect
Despite passage of the landmark healthcare overhaul this spring, the
nation's existing health system is continuing to fray, raising the
prospect that the country could experience a crisis before the law
establishes a new safety net in 2014. (6/21/10, Los Angeles Times)
How Will Health Reform Affect States?
Health reform was enacted into law in Washington, D.C., but many of the
decisions around implementation will be made at the state level. In the
coming months and years, states will wrestle with the economic, legal
and clinical aspects of reform; their ability to successfully navigate
these issues will have a direct impact on tens of millions of
Americans. (6/21/10, RWJF)
What is the Evidence on Health Reform in Massachusetts and How Might
those Lessons Apply to National Health Reform?
As in Massachusetts, national reform includes expansions of public
programs, the creation of health insurance exchanges, subsidies for low-
and moderate-income individuals, an individual mandate, and requirements
for employers, among other provisions. Given the strong parallels
between Massachusetts’ health reform initiative and national health
reform, the experiences in the Bay State provide insights into the
potential effects of PPACA. (6/21/10, RWJF)
HHS to Spend $250 Million to Increase Number of Primary-Care Providers
In an attempt to address a national shortage of health-care workers,
Health and Human Services Secretary Kathleen Sebelius said Wednesday
that the federal government will spend $250 million in programs to
increase the number of doctors, nurses and other care providers.
(6/21/10, Washington Post)
State-Based Case Studies Explore the Costs and Adequacy of Safety Net
Access for the Uninsured
Despite the passage of the federal health reform
legislation, an estimated 20 million people will likely remain uninsured
and reliant on safety net care, making the efficacy of the nation’s
health care safety net a vital issue for policy-makers and health care
advocates. A new series of case studies being released by researchers at
Wake Forest University, in conjunction with the Robert Wood Johnson
Foundation, explores whether well-established safety net systems are
able to provide low-income uninsured people with access to high-quality
care at a reasonable cost. (June 2010, RWJF)
Updated Medicaid Primer Explains Basic Components of Medicaid and the
Program’s Role in Health Reform
The Kaiser Family Foundation has updated Medicaid: A Primer, which
provides an overview of the basic components of Medicaid, the nation's
largest health coverage program. In light of the new health reform law,
the primer now examines how Medicaid will change and expand as it serves
as the mechanism to provide coverage to millions of previously uninsured
low-income adults and children. (6/23/10, KFF)
Conversations: Mary K. Wakefield on Getting Ready to Double the Work of
Clinics
Mary K. Wakefield is the administrator of the Health Resources and
Services Administration, an agency of the U.S. Department of Health and
Human Services. The agency oversees community health centers across the
nation and programs that bring health care to the uninsured. (6/21/10,
Washington Post)
Poll: Favorable Views of Health Reform Law Increasing Among Americans
The health-care overhaul gained popularity from May to June, according
to a new tracking poll. (6/30/10, Washington Post)
New Health-Care Rules Could Add Costs, and Benefits, to Some Insurance
Plans
If you like your health plan, you can keep it. (6/15/10, Washington
Post)
Seeing Threat to Individual Policies, State Officials Urge a Gradual
Route to Change
State insurance officials say they fear that health insurance companies
will cancel policies and leave the individual insurance market in some
states because of a provision of the new health care law that requires
insurers to spend more of each premium dollar for the benefit of
consumers. (6/14/10, NYT)
States Resist HHS Control of Premiums
Some state insurance commissioners are pushing back against a renewed
effort on the Hill to centralize the authority of health insurance
premium rate reviews under the secretary of Health and Human Services.
(7/06/10, Politico)
Back To The Future: CBO Budget Predictions and Health Reform
Here we are again, arguing about whether health care reform will make
the government’s balance sheet better or worse. (7/06/10, KFF)
Making Health Care More Affordable: The New Premium and Cost-Sharing
Credits
explains what these credits are, who is eligible for
them, how much they’re worth, and how they can be used. (5/1/9/10, CBPP)
Rite of Passage: Young Adults and the Affordable Care Act of 2010
discusses provisions in the new law that will help young
adults gain health coverage. Key provisions include dependent coverage
up to age 26, a Medicaid expansion, new health insurance “exchanges,”
and subsidies to help people purchase private insurance. (May 2010, KFF)
What Women Need to Know about Health Reform: Making Health Care More
Affordable
explains that, on average, women are poorer and spend a
greater share of their income on care than men. Therefore, provisions
aimed at preventing medical bankruptcy and increasing access to
affordable coverage, whether through public programs or the private
market, will greatly benefit women. (June 2010, National Women’s Law
Center)
What Women Need to Know about Health Reform: Insurance Reforms
explains how women will benefit from these reforms given
that plans have routinely discriminated against women by using gender
rating, treating domestic violence as a pre-existing condition, and
denying coverage because they’ve had a c-section or breast cancer. New
insurance reforms and the “exchanges” will make it easier for women to
get coverage in a private market that treats everyone fairly. (June
2010, National Women’s Law Center)
What Women Need to Know about Health Reform: Improving Access to
Affordable Preventive Care
looks at how women will benefit from provisions in health
reform that expand coverage for preventive care in private plans,
Medicare, and Medicaid, and that eliminate cost-sharing for those
services. (June 2010, National Women’s Law Center)
Financing New Medicaid Coverage under Health Reform: The Role of the
Federal Government and States
explains that, while all states will see large increases
in federal financing, each state’s share of federal money will depend on
factors such as its Medicaid matching rate, decisions about coverage
made prior to reform, and participation rates. In general, states that
have the furthest to go to meet the new requirements will receive the
largest increases. (May 2010, KFF)
Medicaid Coverage and Spending in Health Reform: National and
State-by-State Results for Adults at or Below 133% FPL
shows that the planned Medicaid expansion will greatly
increase coverage, and the federal government will pay the majority of
the new cost. Any increases in state Medicaid spending will be small
compared to what states would have spent without reform. (May 2010, KFF)
Medicaid Long-Term Services and Supports: Key Changes in the Health
Reform Law
outlines several provisions, such as the expansion of the
home- and community-based services state plan option, the community
first choice option, and the CLASS program. Implementation of these
provisions presents a new opportunity for states to expand access to
home- and community-based services in Medicaid. (June 2010, KFF)
Financial Incentives for Health Care Providers and Consumers
looks at health reform’s efforts to employ financial
incentives to promote the use of effective health services and
discourage the use of marginally effective services. Under reform, HHS
will study the effectiveness of wellness programs, the impact of
incentives on consumer behavior, and the effectiveness of different
types of rewards to ensure that these incentives not only control costs,
but also improve the quality of care. (May 2010, Mathematica)
Understanding the CMS Actuary’s Report on Health Reform
describes
some of the report’s key findings and clears up some of the most common
misconceptions about the report. It explains that the actuary’s report
does not contradict the earlier CBO report, but rather supports its
findings. For example, both reports found that reform will expand health
coverage to more than 30 million people and slow the growth of health
care costs. (5/17/10, CBPP)
A New Era in American Health Care:
Realizing the Potential of Reform
Outlines the key features of the new reform law, discusses
who will be most helped and how, and describes the ways in which the
health care system will begin to provide more patient-centered,
accessible, and coordinated care to all Americans. Through a pragmatic
mix of public and private financing, the new Patient Protection and
Affordable Care Act will expand health care coverage, establish health
insurance market rules that protect individuals and families, and begin
to transform the health care system by encouraging greater value and
efficiency. (6/17/10, Commonwealth Fund)
Medicaid Expansion in Health Reform
Not Likely to “Crowd Out” Private Insurance
"Contrary to claims by some critics, the Medicaid expansion in the new
health reform law will overwhelmingly provide coverage to people who
otherwise would be uninsured, rather than shift people who already have
private coverage to Medicaid." (6/22/10, CBPP)
Childless Adults Who Become Eligible
for Medicaid in 2014 Should Receive Standard Benefits Package
"Among those who will qualify for Medicaid when the program is expanded
nationwide to 133 percent of the poverty line in 2014 are poor and
low-income adults who do not have a disability or live with an eligible
child, a group that is uninsured at higher rates and has greater health
care needs than other uninsured groups. The health reform law allows
states to provide newly eligible Medicaid beneficiaries either with the
regular Medicaid benefits package or with a less comprehensive package,
including one comparable to employer-sponsored health insurance. Given
their greater health needs, uninsured childless adults would be best
served by a comprehensive benefits package identical or comparable to
the package that Medicaid offers to low-income parents and people who
have disabilities. The federal government will pick up the vast
majority of the costs of this Medicaid expansion — 100 percent for the
first three years and 96 percent overall over the next ten years, so
this should be viable for states." (7/6/10, CBPP)
How Will the Health Care System
Change Under Health Reform?
Discusses the ways the new health reform law improves the
affordability of insurance for a variety of populations, including the
uninsured and the underinsured and older and younger adults. Explores
the lesser-known provisions of the Affordable Care Act that emphasize
preventive and primary care and reward health care quality. These key
features will ultimately push the health care system to deliver more
patient-centered, accessible, and coordinated care—improving our
experiences in the doctor's office and hospital. (6/29/10, Commonwealth
Fund)
Moving toward
Health Equity: Health Reform Creates a Foundation for Eliminating
Disparities
summarizes provisions around investing in prevention and public health,
expanding access to coverage, and addressing disparities in health care.
(May 2010, Families USA)
Información
Critica que Debe Saber Sobre La Reforma de Salud
 (provides
information on the health reform law and answers frequently asked
questions about some of the most significant elements of the health
reform law for Latinos in Spanish.)
(2010, National Council of La Raza) (provides
information on the health reform law and answers frequently asked
questions about some of the most significant elements of the health
reform law for Latinos in Spanish.)
(2010, National Council of La Raza)
Health Reform:
How Consumers Will Be Affected
This series of brief reports funded by the Robert Wood Johnson
Foundation explores the effects health reform will have on consumers,
state governments, the economy, and health care costs. The latest
reports look at how different groups of health care consumers will be
affected. In these briefs, Urban Institute researchers focus on young
adults, children, seniors, and those who get their insurance from
individual or small-group markets. (7/6/10, RWJF)
Developing
Innovative Payment Approaches: Finding the Path to High Performance
The
Center for Medicare and Medicaid Innovation, created by the new health
reform law, has a mandate to develop innovative payment models to
improve health care delivery. To achieve higher quality and slower cost
growth, the new center should be prepared to try a variety of approaches
that will encourage and reward more integrated care across the health
care continuum and work with other public programs and private payers
and purchasers to provide consistent incentives for providers and
patients. This paper addresses several issues related to facilitating
the process of identifying, developing, implementing, and monitoring new
initiatives, while recognizing the need to maintain the fiscal integrity
of the Medicare program and to focus on new initiatives that show
promise to improve quality and control costs. (6/8/10, Commonwealth
Fund)
U.S. Approaches
to Physician Payment: The Deconstruction of Primary Care
The authors explore the history of primary care physician reimbursement
and the current system within that context, and illustrate why physician
payment mechanisms are "inadequate for even basic primary care services,
let alone the fully implemented medical home." They argue that new,
hybrid payment models combining the best features of the standard
approaches "will likely be required to restore primary care to its
proper role in the U.S. health care system and to promote and sustain
the development of patient-centered medical homes."(6/3/10, Commonwealth
Fund)
MedPAC Urges
Changes in Doctor Training to Streamline Care
It didn't weigh in directly on the historic health care law, but the
Medicare Payment Advisory Commission (MedPAC) had no small impact on the
legislation, making recommendations that Democrats seized on to cut
Medicare spending and help pay for coverage of the uninsured. Now the
commission's impact could be felt once again—if Congress embraces its
new recommendations to change the training of doctors. (6/21/10,
Commonwealth Fund)
HHS Rolls Out
$250 Million for Training Primary Care Providers
Health and Human Services (HHS) officials announced they'll devote $250
million to training for primary care providers needed to treat Americans
newly insured under the health care law and aging baby boomers. (6/21/10,
Commonwealth Fund)
Cuts to Medicare
Advantage Expected to Set Off a Chain of Blame
During a slow-moving political storm marked by what Harvard pollster
Robert Blendon calls "Level Four" anger, the last thing Democratic
candidates want to face in September is 11 million angry seniors. But
when seniors in Medicare Advantage—the popular program of private health
care plans in Medicare—open their mail this fall and find out how their
coverage will change next year, they won't be happy. (6/21/10,
Commonwealth Fund)
What Will Happen
Under Health Reform--And What's Next?
Newly enacted national health reform will begin, almost immediately, to
transform the U.S. health care system in ways large and small. The
changes will increase the number of people with health insurance, and
affect how many of us obtain coverage, how care is paid for and
delivered, and how it is regulated. The report answers key questions
about health reform for journalists and others and provides a timeline
of reform milestones. (5/13/10, Commonwealth Fund supplement to the
Columbia Journalism Review)
The Impact of
Health Reform on Health System Spending
concludes that significant payment and system reform provisions in the
Patient Protection and Affordable Care Act will begin to realign
incentives within the health care system and reduce cost growth far in
excess of that predicted by the Congressional Budget Office and the
Centers for Medicare and Medicaid Services' Office of the Actuary. The
analysis finds that the health reform law will result in: total
reductions in health care spending of $590 billion from 2010 to 2019; a
reduction in the annual growth rate in national health expenditures from
6.3 percent to 5.7 percent from 2010 to 2019; savings of nearly $2,000
on annual health care premiums for the typical family by 2019; a
reduction in the deficit of up to $400 billion over 10 years; and
Medicare savings of $524 billion. (5/21/10, Commonwealth Fund)
Health Reform:
Help for Americans with Pre-Existing Conditions
Families USA examines the number of Americans diagnosed with
pre-existing conditions, who—absent reform—would be at risk of being
denied coverage in the individual insurance market. To better understand
the effect that health reform will have in Florida, Families USA also
released a state-specific report that reveals the number of Floridians
with pre-existing conditions who will benefit from reform in each age,
racial, and income group.
Near-Term
Changes in Health Insurance: Newly Enacted Health Reform Legislation
Mandates Dozens of Health Insurance Changes
details the provisions that go into
effect during the first two years. Some of the early changes include
requiring new health plans to eliminate cost-sharing for preventive
services, create internal and external appeals processes, and ban
pre-authorization requirements for emergency services. (4/30/10, Health
Affairs)
Making Health
Care More Affordable:The New Premium and Cost-Sharing Health Reform
"Under the new health reform law,
people of modest means will get help paying for health insurance
premiums and ‘cost-sharing’ expenses – costs that people with insurance
have to pay out-of-pocket like co-payments for doctor visits and
hospital care – beginning in 2014. This help will come in the form of
credits that will be available in the new health insurance exchanges."
(5/19/10, CBPP)
Understanding
the CMS Actuary’s Report on Health Reform
The analysis of the health reform
legislation prepared by the chief actuary of the Centers for Medicare &
Medicaid Services (CMS) has been widely misrepresented and
misunderstood. For example, the actuary does not estimate that health
reform will increase the federal deficit nor that health reform will
cost more than CBO estimates. This brief paper explains some of that
report’s key findings and clears up some of the most common
misunderstandings. (5/17/10, CBPP)
7 Changes for
Medical Schools to Train Doctors for Reform Era Care
The U.S. must aggressively reform the way it trains its physicians if
they are to competently provide care to meet the mandates, hopes, and
expectations of health reform. (6/10/10, Carnegie Foundation)
Rite Of Passage:
Young Adults And The Affordable Care Act Of 2010
"As
of 2008, the number of uninsured young adults between the ages of 19 and
29 was nearing 14 million, representing three of
every 10 uninsured persons in the United States," write the authors
about provisions in the Patient Protection and Affordable Care Act of
2010. After reviewing historical data and detailing the new law, authors
of the
brief
conclude: "Young adults will benefit substantially from the ability to
remain on their parent's health plans, an unprecedented expansion in the
Medicaid
program, new insurance market regulations including bans on lifetime
limits and rating based on health status, subsidized private health
insurance with comprehensive benefits package through the new insurance
exchanges, and employer penalties for not offering health insurance"
(Collins and Nicholson, 5/21/10, Commonwealth Fund)
How Will Health
Reform Impact Young Adults?
"In 2014, most
uninsured young adults will either qualify for Medicaid or will be
eligible for subsidies for coverage they purchase in a health insurance
Exchange. The high cost of coverage is currently a major hurdle for
young adults looking for coverage, and the expansion of Medicaid and the
subsidies in the Exchanges are designed to make affordable coverage
available to more uninsured young adults in 2014. ... Gaining health
insurance will extend medical care and provide additional financial
security to young adults as they begin their adult lives" (5/13/10, KFF)
Young Adults
Gain New Coverage Option
"Under the health reform law, young adults up to their 26th birthday can
obtain health coverage through their parents’ health insurance plans.
This marks an important shift from the rules in effect now, under which
young adults usually lose access to their parents’ coverage once they
turn 19 or graduate from college. This brief explains the details and
the impact of the new policy." (6/9/10, CBPP)
Health coverage
for an employee's children under age 27 is now tax-free under the
Patient Protection and Affordable Care Act
according to guidance issued by the Internal Revenue Service. Employers
with "cafeteria plans," which allow employees to choose from a menu of
tax-free benefit options and cash or taxable benefits, can allow
employees to immediately make pre-tax contributions to provide coverage
for children under age 27, even if the cafeteria plan has not yet been
amended to cover these individuals. Plan sponsors then have until the
end of 2010 to amend their cafeteria plan language to incorporate the
change. The tax benefit applies to various workplace and retiree health
plans, and to individuals who qualify for the self-employed health
insurance deduction on their federal income tax return. (4/2/8/10, AHA
News Now)
Health Coverage
for Young Adults: Health Reform Will Soon Allow You to Stay on Your
Parent's Health Plan
The
new health reform law gives new options to uninsured Americans under the
age of 26. Beginning in September 2010, all health plans that provide
dependent coverage for children must extend benefits to adult children
who meet certain eligibility criteria. The right to stay on a parent’s
plan will be especially helpful to young adults who are having
difficulty finding or affording health coverage in the current economy.
Although this provision of the law has not technically gone into effect
yet, many health plans are voluntarily offering young adults the
opportunity to stay on their parents’ plan now so that people who
are graduating from high school or college this spring will not have an
interruption in coverage. (May 2010, Families USA)
Moving toward
Health Equity: Health Reform Creates a Foundation for Eliminating
Disparities
The
Patient Protection and Affordable Care Act, the health reform law that
was signed by President Obama in March, is designed to provide quality
and affordable health care to all Americans by expanding health
coverage, improving quality, and reducing costs. The new law also
provides a critical foundation for addressing racial and ethnic health
disparities through a number of key provisions—both those that will
affect everyone but have a disproportionate impact on communities of
color, as well as those that are designed specifically to eliminate
health disparities. This brief provides a summary of those provisions.
(May 2010, Families USA)
Health Reform:
Help for Americans with Pre-Existing Conditions: State Reports
The new law offers
critical protections for the millions of Americans who have pre-existing
conditions today—as well as for those who are healthy now but who may
develop a health problem as they grow older. As a result of health
reform, no American with a pre-existing condition will be denied
coverage, charged a higher premium, or sold a policy that excludes
coverage of essential health benefits simply because he or she has a
pre-existing condition. This report takes a closer look at the number of
Americans with diagnosed pre-existing conditions who, absent reform,
would be at risk of being denied coverage in the individual insurance
market. The uninsured and those who do not have access to job-based
coverage are at greatest risk, but even those who now have coverage at
work could be at risk if they lose or leave their jobs and have to find
coverage in the individual market. (May 2010, Families USA)
Companies Leap
at Chance to Share in $5 Billion from Health Care Law
The White House is
looking for good news to spread these days when it comes to the new
health care law, and found it in the form of a study from Hewitt
Associates. Hewitt, a consulting firm, said it conducted a survey that
found that most employers who offer retiree health benefits plan to
participate in a new program that would offset their costs for early
retiree medical claims. (6/1/10,
Commonwealth Fund)
Government Run
Health Care
Through demographic change and the economic downturn—and regardless of
reform—the public-sector share of health spending in 2010 will exceed 50
percent for the first time. What do we do now? (5/4/10, H&HN Online)
Health Reform's
Impact: Health Spending to Shrink by $590 Billion, Family Premiums by
$2,000, Over Next Decade
New estimates show that
the health reform law could reduce annual growth in health care spending
from 6.3 percent to 5.7 percent over the next decade—a savings of $590
billion—while lowering annual premiums by nearly $2,000 for the typical
family and extending coverage to 32 million previously uninsured
individuals by 2019. The analysis concludes that significant payment and
system reform provisions in the Patient Protection and Affordable Care
Act will begin to realign incentives within the health care system and
reduce cost growth to a greater extent than predicted by the CBO and the
CMS Office of the Actuary.
(5/21/10, Center for American Progress)
New CBO Estimate
Raises Cost of Health Reform Legislation
The director of the Congressional Budget Office said that the health
care reform legislation could cost, over the next 10 years, $115 billion
more than previously thought, bringing the total cost potentially to
more than $1 trillion. CBO revised the figure due to estimated
discretionary costs to federal agencies as they implement the new health
care reform legislation - such as administrative expenses for the IRS
and DHHS - and the costs for a "variety of grant and other program
spending for which specified funding levels for one or more years are
provided in the act." The new figure is based on estimates of how
Congress will decide to spend money. CBO cautions that lawmakers could
decide to spend less. (5/12/10, AHA News Now)
New Report on
How Health Care Reform Will Help Prevent and Reduce Obesity
There’s a new report out from the Center for American
Progress, entitled, Confronting America’s Childhood Obesity Epidemic –
How the Health Care Reform Law Will Help Prevent and Reduce Obesity.
This report highlights provisions with “the potential to address
childhood obesity,” including nutrition labeling in fast food
restaurants, the childhood obesity demonstration program, and community
transformation grant provisions. (May 2010, Center for American
Progress)
Brief Summarizes
and Explains the Aspects of Health Reform that Take Effect in 2010 and
2011
In a new policy brief, the near-term effects of the Patient Protection
and Affordable Care Act are examined and enumerated, providing context
for key immediate reforms to the private health insurance market that
will take effect in 2010 and 2011. Early insurance market reforms are
associated with two goals of health care reform: (1) reducing barriers
to health insurance and (2) improving the availability of information in
the health care marketplace. (5/4/10, Health Affairs/RWJF)
Key Health
Insurance Market Reforms Not Achievable Without an Individual Mandate
Some opponents of health reform argue that the new law’s individual
mandate — the requirement that individuals must have health coverage or
face a penalty — should be repealed but the law’s most popular insurance
market reforms kept in place. These reforms will bar insurers from
denying coverage to people with pre-existing conditions, charging higher
premiums based on a person’s health status or gender, or placing annual
or lifetime caps on covered benefits. This approach would be doomed to
fail. An individual mandate is essential to the success of insurance
market reforms and to keeping premiums affordable. (5/4/10, CBPP)
Making Health
Care More Affordable: The New Premium and Cost-Sharing Credits
Under the new health reform law, people of modest means will get help
paying for health insurance premiums and “cost-sharing” expenses – costs
that people with insurance have to pay out-of-pocket like co-payments
for doctor visits and hospital care – beginning in 2014. This help will
come in the form of credits that will be available in the new health
insurance exchanges. By providing low- and moderate-income families with
affordable health insurance options, the premium and cost-sharing
credits will reduce the number of people without health coverage and
allow such families to comply with the new requirement to obtain
coverage starting in 2014. Without these subsidies, the new requirement
would place undue burdens on low- and moderate-income people who could
otherwise face the choice of paying for basic necessities such as
housing and food, or purchasing insurance. This brief explains who is
eligible for premium and cost-sharing credits and how they work.
(5/19/10, CBPP)
Health Reform Is
a Good Deal for States
Contrary to claims that the health reform law’s Medicaid expansion will
place an unaffordable burden on states, the federal government will
shoulder nearly all of the cost of the expansion, which will cover 16
million low-income children and adults while raising state Medicaid
spending by just 1.25 percent compared to what states were projected to
spend without health reform. And health reform as a whole, by greatly
expanding health coverage, will result in some reduction in states’
costs for providing care to the uninsured. (4/26/10, CBPP)
CLASS: A New
Voluntary Long-Term Care Insurance Program
The new health reform law
establishes a federal, voluntary long-term care insurance program, known
as Community Living Assistance Services and Supports, or CLASS. This
brief paper describes the need for CLASS, explains its benefits and
financing, and corrects some misconceptions about the program's effect
on the federal budget. (4/16/10, CBPP)
Employer
Responsibility in Health Reform
The recent health reform legislation
requires larger employers to share the responsibility for assuring that
their employees have health coverage. Large firms that employ full-time
workers who obtain subsidized health insurance in the new health
insurance exchanges — rather than employer-sponsored coverage — will be
required to pay a penalty. (5/14/10, CBPP)
How Health
Reform Helps Reduce the Deficit
"The new health
reform law will extend coverage to over 30 million uninsured Americans
and provide important consumer protections to tens of millions of
insured Americans whose coverage may have critical gaps. These coverage
expansions will be more than paid for by specific reductions in spending
for Medicare, Medicaid, and other federal programs and by additional tax
revenues." (5/10/10, CBPP)
Health Reform's
Changes In Medicare
"The new health reform
law includes numerous Medicare provisions that will take effect over the
next five years. Within several years, for example, some payments to
Medicare Advantage plans will be cut, but those plans will be eligible
for bonuses if they can show that they provide high-quality health
care." The brief outlines "many other provisions [that] take effect as
soon as this year" (5/20/10, Health Affairs)
Health Care
Study Calls Risk Pool Money Lacking
The new health care law does not allocate nearly enough money to cover
the estimated 5.6 million to 7 million Americans with pre-existing
medical conditions who will qualify for temporary high-risk insurance
pools, according to a report. (5/27/10, NY Times)
Small-Business
Tax Credits Could Be Early Measure of New Law's Success
The IRS shipped
postcards to more than 4 million small-business owners in April with the
kind of good news rarely expected from the agency — a new tax credit is
available if the businesses help pay workers' health insurance premiums.
The credit is one piece of the new health care law that kicks in
immediately. (5/7/10,
Commonwealth Fund)
Insurers
Scramble to Persuade Regulators to Class Certain Outlays as 'Medical'
The more that current
outlays by health insurers fall into the "medical" category, the easier
it will be for them to meet new minimums in the health care overhaul
dictating how much of every premium dollar must go for medical care and
limiting how much can go for profit and administrative expenses. (5/7/10,
Commonwealth Fund)
Health Reform:
Help for American Indians and Alaska Natives
discusses changes made by the new health reform law, including the
overdue reauthorization of the Indian Health Care Improvement Act (IHCIA),
and explains how these changes will benefit these two groups. (May 2010,
Critical Things
You Should Know About Health Care Reform
provides information on the health
reform law and answers frequently asked questions about elements of the
health reform law that are significant for Latinos. (National Council of
La Raza)
Health Payment
Changes Might Pay Off But They Won't Be Easy, Experts Caution
Major opportunities for
innovation in health payments are at hand that could pave the way for
higher quality care combined with cost savings, but the results may not
be clear until years from now, members of a panel on payment innovation
in the new health care law said.
(5/10/10, Commonwealth Fund)
Medicaid Coverage and Spending in Health
Reform: National and State-By-State Results for Adults at or Below 133%
FPL
This analysis, performed by
the Urban Institute for the Kaiser Commission on Medicaid and the
Uninsured, shows that the expansion of Medicaid under the health reform
law will significantly increase the number of people covered by the
program and reduce the uninsured in states across the country, with the
federal government picking up the vast majority of the cost. The
analysis is among the first to show for all 50 states and DC the
distribution of new Medicaid enrollees and costs, as well as the impact
on the uninsured. Health reform will offer Medicaid coverage to
millions of low-income adults for the first time and help establish a
national floor for Medicaid eligibility that contrasts sharply with the
wide variation in eligibility across state Medicaid programs today.
(5/26/10, KFF)
New Brief
Details How Health Reform Law Affects Medicare
Medicare is the largest
health insurance program in the country, and since Congress passed the
Patient Protection and Affordable Care Act to reform the nation’s health
care delivery system, many Americans have wondered what effect the new
law will have on the popular program that covers seniors and people with
disabilities. a new brief from Health Affairs and the Robert
Wood Johnson Foundation explores the reform provisions related to
Medicare that will take effect beginning in 2010. (5/20/10, RWJF)
New Law Offers
Temporary Aid to Small Firms Seeking Health Insurance for Workers
If you own a small business and are struggling to pay for employees'
health insurance, the new health-care law could provide quick
financial help. (6/1/2010, KFF)
What The New
Health Law Means For You
The new health law signed by President Obama this spring contains the
most sweeping changes to the American health system in a generation.
(6/2/2010, KFF)
Health-Care
Reform to Help Some Soon
Nearly one million U.S. workers will be able to take early advantage
of the health-care reform law that extends health insurance coverage
to adult children up to age 26, a new Hewitt Associates survey
finds. (6/11/2010, Chicago Sun-Times)
Americans
May Give Health Care Law a Chance
Anxious backers of President Barack Obama's health care overhaul law
are starting to see a flicker of hope. 6/1/10, AP)
The Cost of
Health Care Reform May Be Less Than States Fear
"As states complain
about the burden of expanding health care to millions of poor
Americans under the new federal health-care law, a study released
Wednesday suggests their claims may be overstated. The issue is the
cost of expanding
Medicaid ... and the report from the Kaiser Commission on Medicaid
and the Uninsured says states are likely to reap huge benefits for
relatively little cost, and may even end up in the black." (5/27/10,
Fiscal Times)
Innovation in
Medicare and Medicaid Will Be Central to Health Reform's Success
stresses that the new agency, which
will begin full-scale operations in 2011, should be inclusive and
flexible in developing and implementing payment initiatives and should
continuously monitor their impact and rapidly disseminate models that
appear to be successful."If health reform is to succeed in improving
care and curbing spending, this new center must function like a
research and development laboratory for health care delivery, designed
to discover, support, and disseminate the best and most innovative
ideas.” (6/8/10, Commonwealth Fund)
Developing
Innovative Payment Approaches: The Path to High Performance
describes several payment innovations
that the new center should introduce to reward more-integrated,
high-value care, such as medical homes, accountable care
organizations, and bundled payment. (6/8/10, Commonwealth Fund)
Kaiser Report
Analyzes State-by-State Impact of Medicaid Expansion
The expansion of Medicaid under the new health care law will mean a
decrease in the numbers of the uninsured and a significant increase in
public coverage, with most of the tab picked up by the federal
government, according to a new report. (6/1/10, KFF)
Early Benefits
from the Affordable Care Act of 2010 Reinsurance Program for Early
Retirees
explains why early retiree insurance is
important, how the program will work, and answers some frequently asked
questions, including about what types of plans are eligible and what
types of services will qualify for reimbursement. (The White House)
Explaining
Health Care Reform: Questions about Medicaid’s Role
explains how Medicaid works today and
answers some key questions about Medicaid in health reform. Some
questions include how the expansion will be financed, what benefits will
be covered, and what will happen to CHIP. (April 2010, KFF)
Federal
Government Will Pick Up Nearly All Costs of Health Reform’s Medicaid
Expansion
explains why the Medicaid expansion
included in health reform is a good deal for states. In its first five
years, the expansion will add only 1.25 percent to what states were
already projected to spend on Medicaid over the same period. Plus,
expanding health coverage will help states reduce spending on other
services for the uninsured. (4/20/10, CBPP)
Optimizing
Medicaid Enrollment: Perspectives on Strengthening Medicaid’s Reach
under Health Care Reform
reports on interviews with Medicaid
program directors and other experts about how to make the most of the
upcoming Medicaid expansion. All those interviewed saw the expansion as
a strategic moment to recast Medicaid as an affordable program for
working people and families and viewed strong enrollment as essential to
fulfilling reform’s broader coverage goals. (April 2010, KFF)
Health Care
Reform and the CLASS Act
describes the major components of the
CLASS program, including eligibility, benefits, financing, and its
interaction with Medicaid. Going forward, it will be important to
monitor the affordability of premiums, the adequacy of benefits, and
participation rates, as these factors will determine the solvency of the
program. (April 2010, KFF)
"The new health reform law establishes
a federal, voluntary long-term care insurance program, known as
Community Living Assistance Services and Supports, or CLASS. This brief
paper describes the need for CLASS, explains its benefits and financing,
and corrects some misconceptions about the program’s effect on the
federal budget." (4/16/10, CBPP)
"The recent health reform legislation
requires larger employers to share the responsibility for assuring that
their employees have health coverage. Large firms that employ full-time
workers who obtain subsidized health insurance in the new health
insurance exchanges — rather than employer-sponsored coverage — will be
required to pay a penalty."The employer responsibility requirement is
designed to strengthen the system of employer-sponsored insurance, which
is the primary source of health coverage for nonelderly Americans. It
encourages firms that now offer health insurance to continue doing so,
and it encourages firms that do not offer coverage to start. Covering as
many people as possible through employer-sponsored insurance will hold
down the cost of health reform to taxpayers." (4/21/10, CBPP)
Helping People
with Long-Term Health Care Needs: An Insurance Program to Help People
Afford Long-Term Services and Supports
discusses how the CLASS Act includes a
voluntary insurance program that will help people afford the long-term
services they need so they can remain living in the community longer.
Many people who currently require long-term care receive benefits
through Medicaid. However, Medicaid is structured to favor institutional
care over home- and community-based care. (April 2010, Families USA)
Helping People
with Long-Term Health Care Needs: Improving Access to Home- and
Community-Based Services in Medicaid
discusses how the CLASS Act will allow
states to create new options for Medicaid beneficiaries to obtain
home-and community-based services and how it will create incentives for
states to restructure their Medicaid programs to offer home-and
community-based services. (April 2010, Families USA)
Health Insurers
Shifting Costs Ahead of Law: Report
Some of the largest U.S. health insurers are changing their accounting
practices to book administration costs as medical costs in an attempt to
circumvent new industry reforms, according to a U.S. Senate panel's
report released on Thursday. (4/15/10, Reuters)
Poll: Resistance
to Health Care Bill Strong
Opposition to President Barack Obama's health care law jumped after he
signed it - a clear indication his victory could become a liability for
Democrats in this fall's elections. (4/15/10, AP)
Key Health
Insurance Market Reforms Not Achievable without an Individual Mandate
explains that passing important
insurance reforms without a mandate would encourage people to wait until
they are sick to buy coverage. The insurance pool would then have
primarily older, sicker people, which would raise premiums for everyone.
The individual mandate will help get healthy people into the health
insurance market, which would keep premiums at a more reasonable level.
(5/4/10, CBPP)
Efforts to
Nullify Health Reform Likely to Fail, but Could Interfere with Law’s
Implementation
explains why Congress has the authority
to enact the individual mandate and why it is an essential part of
reform. Efforts to repeal the law will more likely weaken public support
and create obstacles to implementation, rather than actually repeal it.
(4/7/10, CBPP)
Health Reform
Implementation Timeline
provides a list of the key provisions in health reform and when they
will be implemented. Some of the earliest provisions to be implemented
include allowing young adults to stay on their parents’ plans until they
are 26 and providing tax credits to small employers that provide health
coverage. (April 2010, KFF)
Medicare
Advantage Payment Provisions: Health Care and Education Affordability
Reconciliation Act of 2010 H.R. 4872
provides an overview of the new payment
policy and analyzes data from 2009 to estimate the impact it will have
on payments to Medicare Advantage plans. The report estimates that the
overall impact will be modest. (April 2010, GWU)
Long-Term
Services and Supports and Chronic Care Coordination: Policy Advances
Enacted by the Patient Protection and Affordable Care Act
provides an overview of the policy
changes organized into five categories: national insurance for
long-term services and supports (LTSS), Medicaid options and incentives
to expand LTSS, chronic care coordination, nursing home reforms, and
other LTSS provisions. (April 2010, National Academy
for State Health Policy)
"Health reform’s
critics argue that states will bear a significant share of the costs of
the new law’s Medicaid expansion, placing an unaffordable financial
burden on states. The argument does not withstand scrutiny. In its first
five years, the Medicaid expansion will add just 1.25 percent to what
states were projected to spend on Medicaid over that period in the
absence of health reform, while providing health coverage to 16 million
more low-income adults and children." (4/20/10, CBPP)
"Some critics of the
recently enacted health reform legislation contend that the
Congressional Budget Office (CBO) cost estimate understates the
legislation’s true cost, because the legislation does not include a fix
to Medicare’s flawed sustainable growth rate (SGR) payment formula for
physicians. Since such a fix is necessary and certain to be enacted,
these critics contend, its cost should be considered part of the cost of
the health reform legislation. That claim, however, is mistaken. The
cost of fixing the SGR formula is entirely unrelated to health reform,
as is easily seen: The cost of fixing the formula would be incurred in
full even if health reform legislation had not passed or were repealed."
(4/21/10, CBPP)
What Will the
New Health Reform Law Do in the First Year?
This report highlights
all the people and communities that will be helped within the first year
of passing the health reform law. From people with pre-existing
conditions to community health centers, millions stand to gain within
the first 12 months. (April 2010, Families USA)
First 90 Days
State Advocates’ To-Do List
Many provisions within
the new health reform law take affect within the first 90 days after
enactment. In order to ensure the new law is implemented effectively and
in the most consumer-friendly way, we have created a “to-do” list for
state advocates. (April 2010, Families USA)
"The new health reform
law includes a new minimum Medicaid eligibility standard that will allow
millions of uninsured low-income adults to qualify for Medicaid?. While
states do not have to expand Medicaid until 2014, a new coverage option
included in PPACA allows states to cover low-income adults now."
(4/20/10, CBPP)
Early Medicaid
Expansions under Health Reform
The new health reform
law calls for an expansion of Medicaid by January 2014, but starting in
April of this year, states are able to phase in this expansion through a
state amendment process. This report discusses how states can go about
expanding their Medicaid programs early and why they should. (May 2010,
Families USA)
Efforts to Halt
Health Reform: Playing Politics with Our Health
Since the signing of
the health reform bill into law, opponents have been out in an effort to
repeal or weaken the law. This report highlights opponents’ efforts as
nothing more than political ploys and counters their misinformation with
facts. (April 2010, Families USA)
A Summary of the
Health Reform Law
The new law expands health insurance coverage to an estimated 32 million
uninsured Americans and strengthens existing coverage. This summary
describes major changes in health coverage as a result of health reform,
including Medicaid and CHIP coverage, the new affordability provisions,
the exchanges, the new individual and employer responsibility
requirements, improvements in private market coverage, and changes to
Medicare and long-term services and supports. This is not a
comprehensive summary of the entire health reform law.
(April 2010, Families USA)
Health Coverage
in the States: How Will Health Reform Help?
These reports discuss
major gaps in state health coverage systems—gaps that allow insurers to
discriminate against people with pre-existing conditions, to charge
premiums that are unaffordable for families and businesses, and to make
obtaining care difficult even for those who have insurance. We also
discuss the significant ways that health reform addresses these gaps,
providing help to residents across the states. (March 2010, Families
USA)
Health Reform
Law Will Benefit Women With Individual, Small Group Insurance
 NPR's
"Morning Edition" on Friday examined how the new health reform law could
"improve women's experiences" with health insurance in the individual
and small group markets. (4/23/10, NPR) NPR's
"Morning Edition" on Friday examined how the new health reform law could
"improve women's experiences" with health insurance in the individual
and small group markets. (4/23/10, NPR)
(2) ... PPACA Acronyms and Glossary
 The Alliance for Health has produced a wonder list of acronyms and a
glossary for health care reform/PPACA.
The Alliance for Health has produced a wonder list of acronyms and a
glossary for health care reform/PPACA.
As usual, Jeanne hasn't left it alone... her comments and
additions/changes are indicated in bold green.
ACRONYMS AND GLOSSARY
Content Last Updated: 10/7/2010 2:30 PM,
MST
Acronyms
The following list is a guide to some of the more common acronyms and
abbreviations for health care agencies, terms and programs. A number of
these acronyms and abbreviations are defined in the glossary.
ACF - Administration for Children and Families
ACA – Affordable Care Act
-- see Patient Protection and Affordable Care
Act ("PPACA")
ACO – Accountable Care Organization
ADL - Activities of Daily Living
AHRQ - Agency for Healthcare Research and Quality
ALF - Assisted Living Facility
ASO - Administrative Services Only Agreement
CAH - Critical Access Hospital
CBO - Congressional Budget Office
CCRC - Continuing Care Retirement Community
CDC - Centers for Disease Control and Prevention
CHC - Community Health Center
CHIP – Children’s Health Insurance Program (formerly State Children’s
Health Insurance Program)
CLASS Act – Community Living Assistance Services and Support Act
CMS - Centers for Medicare and Medicaid Services
COBRA - Consolidated Omnibus Budget Reconciliation Act of 1985
CPI - Consumer Price Index
CRS - Congressional Research Service
DME - Durable Medical Equipment; Direct Medical Education Payment
DRA - Deficit Reduction Act of 2005
DRG - Diagnosis-Related Group
DSH - Disproportionate Share Hospital Adjustment
EHR – Electronic Health Record
EMR – Electronic Medical Record
EOL – End-of-life
EPSDT - Early and Periodic Screening, Diagnostic and Treatment Services
ERISA - Employee Retirement Income Security Act
ESI – Employer -Sponsored Insurance
ESRD - End-Stage Renal Disease
FDA - Food and Drug Administration
FEHBP - Federal Employees Health Benefits Program
FFS - Fee-for-Service
FMAP - Federal Medical Assistance Percentage
FPL - Federal Poverty Level or Line
FQHC - Federally Qualified Health Center
FSA – Flexible spending account/arrangement
GAO - Government Accountability Office
GME - Graduate Medical Education Payment
HCBS - Home and Community-Based Services
HCERA - Health Care and Education
Reconciliation Act of 2010
HCFA - Health Care Financing Administration
HCTC – Health Coverage Tax Credits
HEDIS - Health Plan Employer Data and Information Set
HHA - Home Health Agency
HHS - Department of Health and Human Services
HI –Medicare Hospital Insurance Trust Fund (also known as Part A)
HIT – Health Information Technology
HIFA - Health Insurance Flexibility and Accountability Demonstration
Initiative
HIPAA - Health Insurance Portability and Accountability Act
HMO - Health Maintenance Organization
HOA - Health Opportunity Account
HPSA - Health Professional Shortage Area
HRA - Health Reimbursement Arrangement/Account
HRSA - Health Resources and Services Administration
HSA - Health Savings Account
IADL - Instrumental Activities of Daily Living
ICF/MR - Intermediate Care Facility for the Mentally Retarded
IGT - Intergovernmental Transfer
IHS - Indian Health Service
IME - Indirect Medical Education Adjustment
IOM – Institute of Medicine
IPA - Independent Practice Association
JCAHO – former abbreviation for The Joint Commission
LTC - Long-Term Care
MA-PD - Medicare Advantage Prescription Drug
MCH - Maternal and Child Health
MCO - Managed Care Organization
MedPAC - Medicare Payment Advisory Commission
MEWA - Multiple Employer Welfare Association
MHPA - Mental Health Parity Act
MLR – Medical Loss Ratio
MMA - Medicare Prescription Drug, Improvement and Modernization Act of
2003
MRDD - Mental Retardation and/or Developmental Disability
MSA - Medical Savings Account
MSP - Medicare Savings Program
NAIC – National Association of Insurance Commissioners
NCQA - National Committee for Quality Assurance
NDEP - National Diabetes Education Program
NIH - National Institutes of Health
NP/RNP - Nurse Practitioner (Registered)
OCIIO – Office of Consumer Information and Insurance Oversight
ONC - Office of the National Coordinator for Health Information
Technology
OMB - Office of Management and Budget
P4P - Pay for Performance
PACE - Program of All-Inclusive Care for the Elderly
PBM - Pharmacy Benefit Manager
PCCM/PCI/PCC - Primary Care Case Management, Initiative, or Clinician
PCMH - Patient-Centered Medical Home
PCORI – Patient- Centered Outcomes Research Institute
PDP - Prescription Drug Program
PHS - U.S. Public Health Service
POS - Point-of-Service Plan
PPACA – Patient Protection and Affordable Care Act
(also referred to incorrectly as ACA by those who should know better
<sigh>)
PPO - Preferred Provider Organization
PPS - Prospective Payment System
PSO - Patient Safety Organization
QALY - Quality-Adjusted Life Year
QIO - Quality Improvement Organization
QMB - Qualified Medicare Beneficiary
RBRVS - Resource-Based Relative Value Scale
RVS - Relative Value Scale
SAMHSA - Substance Abuse and Mental Health Services Administration
SBHP - Small Business Health Plan
S-CHIP - State Children's Health Insurance Program (now CHIP—Children’s
Health Insurance Program)
SGR - Sustainable Growth Rate
SHIP - State Health Insurance Assistance Program
SLMB - Specified Low-Income Medicare Beneficiary
SMI – Medicare Supplementary Medical Insurance (also known as Part B)
SNF - Skilled Nursing Facility
SSA - Social Security Administration
SSDI - Social Security Disability Income
SSI - Supplemental Security Income
STAR*D - Sequenced Treatment Alternatives to Relieve Depression
TANF - Temporary Assistance for Needy Families
TMA - Transitional Medical Assistance
TPA - Third Party Administrator
UPL - Upper Payment Limit
UR - Utilization Review
Glossary Terms
Terms underlined in definitions are defined in this glossary.
A
ACCOUNTABLE CARE ORGANIZATION (ACO) --
According to Dr. Elliott Fisher of Dartmouth Medical School, an
originator of the concept, an ACO is a provider-led organization whose
mission is to manage the full continuum of care and be accountable for
the overall costs and quality of care for a defined population. Under
the health reform law (PPACA), HHS is to establish an ACO
demonstration by January 2012.
ACTIVITIES OF DAILY LIVING (ADL) - An index or scale which
measures a patient's degree of independence in bathing, dressing, using
the toilet, eating and transferring (moving from a bed to a chair, for
example). Used to determine need for long-term care and eligibility for
payments for care by insurers.
ACUTE CARE - Medical services provided to treat an illness or
injury, usually for a short time. Contrast with Chronic Care.
ADMINISTRATIVE SERVICES ONLY (ASO) AGREEMENT - A contract
typically between an insurance company and a self-funded plan or group
of providers in which the insurance or management company performs only
administrative services (billing, plan design, claim processing,
marketing, for example) and does not assume any risk. Also see
Self-Insurance.
ADVANCEABLE TAX CREDIT - A subsidy to help pay for health
insurance that is available when the insurance premium is due, without
having to wait until a year-end tax return is filed. Also see Tax
Credit.
ADVERSE SELECTION - When a disproportionately high number of
individuals in poorer than average health enroll in a health plan.
AFFORDABLE CARE ACT (a shortening of Patient Protection and
Affordable Care Act of 2010) - Law enacted in March 2010, phasing in
major expansions in insurance coverage, changes in insurance rules, and
delivery system changes, phased in over the next several years.
(do not use, lazy man's acronym, there are too many ACAs out there, only
one PPACA)
AMBULATORY CARE - Medical service provided on an outpatient basis
(no overnight hospital stay. Services may include diagnosis, treatment,
surgery and rehabilitation.
ANCILLARY CHARGE - The fee associated with additional services
performed before, or secondary to, a significant procedure such as
surgery. Ancillary charges are for services such as lab work, X-ray or
anesthesia. Also, an additional patient charge above the copayment and
deductible amount which the covered person is required to pay by the
insurer.
ANY WILLING PROVIDER - A requirement - typically a state law -
that a managed care organization must accept any properly
licensed provider willing to meet the terms of a plan's contract,
whether the organization wants or needs that provider. Often described
by managed care groups as "anti-managed care" legislation.
APPEAL- A request for review of a denial of coverage of a
particular medical service or inadequate payment for services already
received. Medicare beneficiaries have the right to appeal in
either of these circumstances, whether they are enrolled in traditional
Medicare or in a Medicare health maintenance organization. Also
see Grievance.
ASSISTED LIVING FACILITY (ALF) - A group residence offering
24-hour assistance to those who may need some help with activities of
daily living, but who do not need the level of medical and nursing
care offered by skilled nursing facilities.
ASSOCIATION HEALTH PLAN (AHP) - Health insurance arrangement
sponsored by business coalitions and trade and professional
associations. AHPs operate under states' insurance laws and regulations.
Recent legislative proposals would regulate AHPs primarily under federal
law. Also see Small Business Health Plan.
B
BALANCE BILLING - A provider's bill to a covered person for
charges above the amount paid by the health plan or insurer.
BEHAVIORAL HEALTH SERVICES - Medical services encompassing mental
health care and substance abuse treatment.
BIOSURVEILLANCE - Automated monitoring of health data sources of
potential value in identifying trends that may indicate an emerging
epidemic, whether naturally occurring or the result of bioterrorism.
BLOCK GRANT - A lump sum of money given to a state or local
government to be spent for certain purposes. Normally, it is based on a
formula, the objectives are broadly defined and the grant's source
places relatively few limits on the money's use.
BUNDLING - The use of a single comprehensive charge or payment
for a group of related health services. Contrast with Unbundling.
C
CAFETERIA PLAN (Section 125 Plan) – A cafeteria plan provides
participants an opportunity to receive certain benefits, such as
reimbursement for some out-of-pocket medical expenses, on a pretax
basis. It is a separate written plan maintained by an employer for
employees that meets the specific requirements of, and regulations of,
Section 125 of the Internal Revenue Code.
CAP - See Out-of-Pocket Cap
CAPITATION - Method of payment for health services in which a
health care provider is paid a fixed amount for each person on the
provider's patient roster, regardless of the actual number or nature of
services provided to each person.
CARRIER - An entity which may underwrite or administer a range of
health benefit programs. May refer to an insurer or a managed health
plan.
CARVE-OUTS - A payer strategy in which a health maintenance
organization (HMO) or insurance company isolates ("carves out") a
benefit and hires another organization to provide this service. Common
carve-outs include behavioral health and prescription drugs. The
technique is intended to allow the insurer to better control its costs.
CASE MANAGEMENT - A process where a health plan identifies
covered persons with specific health care needs, then devises and
carries out for them a plan to achieve the best patient outcome in the
most cost-effective manner.
CASE MIX - The mix of patients treated within a particular
institutional setting such as a hospital or under a particular health
plan. Case mix may be measured by the severity of patients' illnesses or
the prospective use of care resources.
CASE MIX ADJUSTMENT - Change in payment to a health plan or
provider to avoid overpaying or underpaying where health status or
likely use of services varies from average.
CASH AND COUNSELING- A Medicaid program that allows
certain Medicaid beneficiaries, frail elders and adults with
disabilities to purchase their own personal care and related services.
Medicaid provides a monthly allowance, the amount of which is determined
after assessing the beneficiary's need for community-based long-term
care services. As of October 2011, Cash and Counseling will be replaced
by the Community First Choice Option, a provision of the Affordable
Care Act that will be available in all states. For more information,
see
Chapter 9, Long-Term Care.
CATASTROPHIC HEALTH INSURANCE - Health insurance which provides
protection against the high cost of treating severe or lengthy
illnesses. Such policies cover all or most of medical expenses above a
relatively high specified amount.
CATASTROPHIC ILLNESS - A very serious and costly condition that
could be life threatening or cause life-long disability and which often
involves severe financial hardship.
CATEGORICAL ELIGIBILITY- Medicaid's eligibility pathway
for individuals who can be covered. The program's 25+ categories have
been organized into five broad groups - children, pregnant women, adults
in families with dependent children, individuals with disabilities and
the elderly. The Affordable Care Act will expand Medicaid eligibility to
all individuals under age 65 with incomes up to 133 percent of the
federal poverty level and who are not eligible for Medicare, effective
Jan. 1, 2014. For more information, see
Chapter 8, Medicaid.
CENTERS OF EXCELLENCE - Health care facilities selected to
deliver specific services, often exclusively, based on criteria such as
experience, outcomes, efficiency and effectiveness.
CERTIFICATE OF NEED - The requirement that a health care
institution obtain permission from an oversight agency before making
major changes to its facilities or facility-based services, or before
building new facilities.
CHERRY PICKING - The practice of insurance companies taking only
those businesses or individuals that are good health risks, and avoiding
businesses or people that have higher health risks. Also called
“skimming.” Also called "adverse
selection," as commercial insurers have become experts at
selectively advertising and promoting their products. For example, I
live in an area of relatively upscale homes in Arizona owned in many
cases by fairly affluent seniors who are active, playing golf and
tennis, taking belly-dancing lessons. The big Medicare Advantage (Part
C) commercial insurers throw dinner parties to enroll seniors here.
Trust me, I'm a lawyer, they don't throw dinner parties in in the inner
city. Poor people live there; poor people are also sicker and more
likely to actually use the MA plan ... bad for profits. The old
anecdotal story about MA plans having their enrollment offices on the
second floor of walk-up buildings rings true. If your not healthy enough
to navigate a flight of stairs, we don't want you.
CHILDREN'S HEALTH INSURANCE PROGRAM (CHIP) - A program enacted by
Congress in 1997 that provides federal matching funds for states to
spend on health coverage for uninsured kids. The program is designed to
reach uninsured children whose families earn too much money to qualify
for Medicaid but are too poor to afford private coverage.
Congress initially authorized CHIP for a 10-year period that expired at
the end of September 2007. CHIP was reauthorized and enlarged early in
2009. The bill, signed on February 4, 2009, increases CHIP funding by
about $32 billion through 2013 to cover an additional 4 million
children. The Patient Protection and
Affordable Care Act of 2010 requires states to maintain
existing income eligibility levels for children in CHIP (and Medicaid)
until 2019 and extends funding for CHIP through 2015. Beginning in 2015,
states will receive a 23 percentage point increase in the percentage of
CHIP funding paid by the federal government, up to a cap of 100 percent.
For more information, see
Chapter 6, Children's Coverage. Jeanne's
Note: An expansion of S-CHIP was vetoed by President George W. Bush in
2007 the bill had modest GOP support then) with the message from W saying:
"All Americans have access to health care, all they have to do is go to
the hospital emergency room." Ah, such compassionate tea-party
conservatism!
CHRONIC CARE - Medical services provided to those with chronic
conditions. Contrast with Acute Care.
CHRONIC CONDITION - A condition that is not expected to improve,
that lasts a year or longer or recurs, and may result in long-term care
needs. Chronic illnesses include Alzheimer's disease, arthritis,
diabetes, epilepsy and some mental illnesses.
CLASS ACT -
PPACA creates a
voluntary
LTC insurance program (CLASS) with cash benefits to disabled
adults.
Neither private health insurance nor Medicare cover basic Long
Term Care services. Private LTC coverage is available in the
individual insurance market, but policies have high premiums and
limited benefits. Many families deplete their resources and are
forced onto Medicaid for long-term care. 40% of the people who
need LTC are non-elderly with serious disabling conditions.
Working-age adults will be able to choose to have premiums
deducted from their paychecks to purchase public LTC insurance
through CLASS, starting in 2012 or 2013.
No one will be required to participate in CLASS.
Employers may elect to enroll their workers automatically,
but if so, a worker will be able to opt out. The younger the age
at which a person enrolls, the lower the premium. Enrollees can
continue to participate by paying premiums after they leave the
labor force or retire. If they become disabled, enrollees who
have contributed for at least 5 years will automatically qualify
for help to purchase home-based services, assisted living, or
nursing home care.
CLAWBACK- Popular term for "phased-down state contribution" that
describes how the federal government is recovering (or "clawing" back,
from the states' perspective) money spent on Medicare-covered
drugs for persons dually eligible for Medicare and Medicaid.
Since January 2006, states have made monthly payments to the federal
Medicare program, reflecting the amount of money they spent on
prescription drugs for Medicaid-eligible seniors (known as dual
eligibles) before the enactment of Medicare Part D. Payments
were set at 90 percent of costs in FY 2006, decreasing to 75 percent by
FY 2015. However, because of the recession of 2007 – 2009, the federal
government reduced the amount each state must pay from Oct. 1, 2008
through the end of 2010.
CLOSED PANEL/CLOSED ACCESS - A term that describes health plans
in which enrollees are permitted to receive non-emergency services only
through specified providers. Group- and staff-model HMOs are
examples of closed panel plans.
COINSURANCE- A portion of the bill for a medical service that is
not covered by the patient's health insurance policy and therefore must
be paid out of pocket by the patient. Coinsurance refers to a
percentage, e.g., 10 percent of the total charge up to a specified
maximum. Contrast with Copayment, which is stated as a flat
amount, e.g., $5 per office visit.
COMMUNITY HEALTH CENTER (CHC) - Organization providing
comprehensive primary care to medically underserved populations,
regardless of their ability to pay. These public and non-profit entities
receive federal funding under Section 330 of the Public Health Service
Act, as amended.
COMMUNITY RATING - A method for setting premiums at the same
price for everyone, based on the average cost of providing health
services to all. The premium is not adjusted for the individual
beneficiary's medical history or likelihood of using medical services.
Contrast with Experience Rating and Modified Community Rating.
COMPARATIVE EFFECTIVENESS - Research that compares clinical
outcomes, or the “clinical effectiveness,” of alternative therapies for
the same condition. Many analysts believe that comparative effectiveness
research evidence can lead to better health care decisions and thus to
improved quality of care, improved efficiency, and ultimately, to the
potential for cost savings throughout the health system.
CO-MORBIDITIES - Medical conditions that exist at the same time
as the primary condition in the same patient (e.g., hypertension is a
co-morbidity of many conditions such as heart disease, end-stage renal
disease and diabetes).
CONSOLIDATED OMNIBUS BUDGET RECONCILIATION ACT OF 1985 (COBRA)
- This law includes one part which entitles former employees of
companies with 20 or more workers to continue to receive coverage under
the group plan for up to 18 months after leaving, if they pay the full
cost of the coverage.
Click here for more information.
CONSUMER-DIRECTED OR CONSUMER-DRIVEN HEALTH PLAN - Includes plans
that are coupled with health spending accounts into which
employers or individuals contribute pre-tax dollars to be used for
health care purchases. These mechanisms aim to change employees from
receivers of health care into purchasers by having them participate more
fully in health care and cost decisions. Also see Health
Reimbursement Arrangement and Health Savings Account.
CONSUMER PRICE INDEX (CPI)- A statistical measure of the annual
change in cost to workers of purchasing a market basket of goods and
services. It is expressed as a percentage of the cost of these goods and
services during a base period. CPI is also known as retail price index
or cost-of-living index.
CONTINUING CARE RETIREMENT COMMUNITY (CCRC)- Housing community
designed to provide different levels of long-term care under contract.
Services usually include home care, support in an assisted
living facility and care in a nursing home.
CONVERSION PRIVILEGE - Right given to an insured person under a
group insurance contract to change coverage, without evidence of medical
insurability, to an individual policy upon termination of the group
coverage. Conversion privileges are guaranteed to many workers under the
Consolidated Omnibus Budget Reconciliation Act of 1985, and to
others under the Health Insurance Portability and Accountability Act
of 1996.
COPAYMENT – A flat amount paid out of pocket per medical service,
e.g., $5 per office visit.
COST SHARING - Any out-of-pocket payment the patient makes for a
portion of the costs of covered services. Deductibles,
coinsurance, copayments and balance bills are types of
cost sharing.
COST SHIFTING - The practice by which a seller of a health
service, such as a hospital, increases charges for some payers to offset
losses due to uncompensated or indigent care or lower payments from
other payers.
CRITICAL ACCESS HOSPITAL (CAH) - Limited-service hospital located
in rural areas and meeting certain size, location and other
requirements. CAHs are subject to less rigorous staffing standards and
receive reimbursement from Medicare based on their actual costs,
rather than by the more common (and less favorable) payment tied to
average costs for treating a particular diagnosis.
CROSS-SUBSIDY - The concept of certain purchasers paying more for
medical services than they otherwise would so that others can pay less
(or nothing at all), or another activity can be funded. In the U.S.
health system, this mechanism has been used to pay for medical services
for the poor and uninsured, medical education and research.
CROWD-OUT - A phenomenon whereby public health coverage programs
encourage some employers to drop health coverage, urging their employees
instead to take advantage of the subsidies available to them in the
public program.
CUSTODIAL CARE - Long-term care services which do not seek to
cure, provided during periods when the medical condition of the patient
is not changing or does not require continued delivery by medical
personnel.
D
DEDUCTIBLE - A fixed amount, usually expressed in dollars in the
form of an annual fee, that the beneficiary of a health insurance plan
must pay directly to the health care provider before a health insurance
plan begins to pay for any costs associated with the insured medical
service. Contrast with Copayment.
DEFENSIVE MEDICINE - The practice of health care providers
ordering tests that may not be necessary to over-protect themselves from
potential malpractice lawsuits. Said to be a major cause of high health
care costs.
DEFICIT REDUCTION ACT OF 2005 (DRA) - The DRA made significant
changes to the Medicaid program - for example, allowing states to
increase premiums and cost-sharing for families and to base benefits on
private plans. The law also tightened long-term care asset transfers and
capped home equity at $500,000. A DRA provision effective July 1, 2006,
requires Medicaid beneficiaries to show proof of citizenship upon
applying for or renewing their benefits. For more information, see
www.kff.org/medicaid/7465.cfm.
DEFINED BENEFIT - A health insurance model used by an employer or
government program where specified health services covered under the
plan are standardized and guaranteed. The cost of providing the standard
benefits may fluctuate. One example of a defined benefit plan is
Medicare. Contrast with Defined Contribution.
DEFINED CONTRIBUTION - A health benefit model used by employers
or government programs where health services covered may fluctuate based
on choice of plan, but the employer or government contributes a set
amount (percentage or dollar amount) towards the purchase of the
selected health plan. A defined contribution plan limits the financial
liability of employers or the government, because the contribution is
defined, or fixed. Contrast with Defined Benefit.
DIAGNOSIS-RELATED GROUP (DRG) - A way of determining payments to
hospitals, used under Medicare's prospective payment system (PPS)
and by some other public and private payers. The DRG system classifies
patients into groups based on the principal diagnosis, treatments and
other relevant criteria. Hospitals are paid the same for each case
classified in the same DRG, regardless of the actual cost of treatment.
DIRECT CONTRACTING - A method for providing health services to
covered employees and their families, by group providers who contract
directly with an employer, thereby cutting out "the middleman" or
insurance carrier.
DIRECT GRADUATE MEDICAL EDUCATION PAYMENT - Medicare
payment to approved teaching hospitals to help cover the direct costs of
training residents to become board-eligible in their field. Hospitals
receive full payments to help cover resident salaries, fringe benefits
and compensation for attending physicians, for residents in their
initial residency period (the minimum number of years required to
qualify for board certification in that specialty) and half payments for
residents who have completed their initial training and are
sub-specializing. Direct GME payments vary significantly among hospitals
and depend on the number of residents at the hospital, the hospital
specific per resident amount and the size of the hospital's inpatient
Medicare population. For more information, see
www.cogme.gov. Also
see Graduate Medical Education Payment and Indirect Medical
Education Adjustment.
DIRECT-TO-CONSUMER (DTC) ADVERTISING - The use of mass media
(television, newspapers, magazines, etc.) and other forms of reaching
the general public. DTC advertising is often used by the pharmaceutical
industry to promote their products. These advertisements must meet
certain standards under federal regulations.
DISPROPORTIONATE SHARE HOSPITAL (DSH) ADJUSTMENT - An
increased payment under Medicare's prospective payment system
or under Medicaid for hospitals that serve a relatively large
number of low-income uninsured patients.
DOUGHNUT HOLE - Coverage gap in Medicare Part D
prescription drug coverage. For 2010, the beneficiary pays for the first
$310 of prescription drug costs out of pocket. Then Medicare pays
75 percent of the beneficiary's yearly drug expenses up to $2,830, after
which there is a gap in coverage - the doughnut hole. The beneficiary
must pay the full cost of drugs out of pocket. The coverage resumes when
total prescription drug expenses reach $4,550, after which the
beneficiary pays $2.40 for each generic drug prescription and $6 for
other drugs (or 5 percent of total drug expenses, whichever is higher)
through the end of the year. Under the Affordable Care Act, there will
be a gradual phase out of the doughnut hole. In June 2010, per the new
law, Medicare beneficiaries who have entered the doughnut hole began
receiving a $250 rebate. Beginning January 1, 2011, PPACA shrinks the
donut hole by reducing beneficiary copayments each year, until the donut
hole is essentially eliminated by 2020. See
Chapter 7, Medicare, for details.
DRUG REIMPORTATION - The process by which individuals or groups
purchase pharmaceuticals from other countries that were originally
produced in the U.S. and exported for consumption abroad. Because many
other countries have lower drug prices than the U.S., this process can
save consumers money on drugs for personal use. Reimportation can occur
either by traveling to another country to purchase drugs (e.g., driving
to Canada), or by purchasing drugs over the Internet or by mail from
foreign pharmacies. Though traditionally not the subject of law
enforcement, most reimportation violates U.S. federal drug safety laws.
DUAL ELIGIBLE - A Medicare beneficiary who also receives
either a full range of Medicaid benefits offered in his or her
state, or help with Medicare out-of-pocket expenses. Also see
Qualified Medicare Beneficiary and Specified Low-Income Medicare
Beneficiary.
DURABLE MEDICAL EQUIPMENT (DME) - Medical devices such as
wheelchairs, oxygen tanks and apnea monitors.
E
EARLY AND PERIODIC SCREENING, DIAGNOSTIC AND TREATMENT SERVICES (EPSDT)
- Comprehensive services states are required to provide to Medicaid-enrolled
children who need them, including extensive services for children with
disabilities. The Deficit Reduction Act of 2005 allows states to
restructure children's benefits to provide a narrower array of services
for healthy children; however, states must continue to provide
wrap-around EPSDT benefits.
ELECTRONIC HEALTH RECORD (EHR) – Some in the health care field
consider the term “electronic health record” to be virtually identical
to “electronic medical record” (see below). Others consider an
electronic health record to be a more patient-oriented Web-based set of
information about the patient and his or her care, easily accessible by
the patient and owned by the patient.
ELECTRONIC MEDICAL RECORD - A computer-based record containing
details about a patient’s encounter with a health care provider or
facility, such as the patient’s chief complaint, vital signs, medical
history, medical orders, plans and prescriptions. An EMR is a legal
document and must meet all of the statutory and regulatory requirements
for paper medical records. It is owned by a professional practice,
hospital or other health care facility. Also known as a computerized
patient record. Contrast with Electronic Health Record.
EMPLOYEE RETIREMENT INCOME SECURITY ACT (ERISA) - Enacted in
1974, ERISA was primarily designed to secure workers' pension rights.
The law established federal reporting and disclosure requirements for
most private employee health plans. Under ERISA, companies that pay for
their workers' health benefits directly (e.g. by self-insuring and
assuming all or most financial risk) are exempt from state insurance
regulations and taxes. ERISA also limits workers' ability to sue their
insurer.
Click here for more information.
EMPLOYER CONTRIBUTION REQUIREMENT OR "EMPLOYER MANDATE" - A state
requirement that employers either provide health care benefits to their
workers or pay a fee that contributes to the cost of covering their
workers under a public (state) plan. The Affordable Care Act creates a
type of employer mandate, in that employers with 50 or more employees
who don’t offer coverage as of Jan. 1, 2014 will have to pay a fee per
full-time employee.
EMPLOYER-SPONSORED INSURANCE (ESI) - A voluntary system in
which employers choose to provide health insurance for employees.
END-STAGE RENAL DISEASE (ESRD)- Kidney disease that is severe
enough to require lifetime dialysis or a kidney transplant. People of
all ages who have ESRD are eligible for Medicare.
ENTERPRISE LIABILITY - Proposal to hold hospitals or health
maintenance organizations liable for negligent harm in medical
malpractice cases, rather than holding individual physicians liable.
EVIDENCE-BASED MEDICINE- The use of current best clinical
research evidence in making decisions about the care of individual
patients, often with the assistance of information technology.
EXPERIENCE RATING - Process of determining insurance premiums for
a group that is based wholly or partially on that particular group's
past use of services and expenses incurred. Contrast with Community
Rating.
F
FAMILY CAREGIVER - Spouses, daughters and daughters-in-law, sons
and other relatives and friends who volunteer to help with personal
care, medication management and a range of household and financial
matters. Sometimes referred to as "informal caregivers."
FEDERAL EMPLOYEES HEALTH BENEFITS PROGRAM (FEHBP) - Health care
plans offered to federal civilian employees who can annually choose
among a number of approved, community-rated private health insurance
plans. The federal government pays a major portion of the cost of the
coverage.
Click here for more information, including eligibility requirements
and premiums for each health plan --in total and amounts paidon the
employee's behalf.
FEDERAL MEDICAL ASSISTANCE PERCENTAGE (FMAP) - Percentage used to
determine the amount of federal matching funds for state Medicaid
expenditures. Before the recession of 2008 – 2009, the FMAP was not less
than 50 percent or more than 80 percent. Congress increased the federal
match in the American Recovery and Reinvestment Act of 2009 to help
states during the recession, and later extended increased FMAP payments
through June 2011.
Click here
for more information.
FEDERAL POVERTY GUIDELINE - Income amounts set each February by
the U.S. Department of Health and Human Services used to determine an
individual's or family's eligibility for various public programs,
including Medicaid and the State Children's Health Insurance Program.
Sometimes called Federal Poverty Level/Line (FPL). (The poverty
guidelines are different from the U.S. Census Bureau's "poverty
thresholds," which are used for Census statistical purposes.)
Click here for the 2010 poverty guidelines.
FEDERALLY QUALIFIED HEALTH CENTER (FQHC) - Facilities that have
been approved by the government for a program to provide low cost health
care. They include community health centers, tribal health clinics,
migrant health centers, rural health centers and health centers for the
homeless.
FEE-FOR-SERVICE (FFS) - A method of paying health care providers
a fee for each medical service rendered, rather than paying them
salaries or capitated payments.
FIRST-DOLLAR COVERAGE - Insurance plans that provide benefits
without first requiring payment of a deductible.
FIRST RESPONDERS - Firefighters, police officers, ambulance
crews, doctors and other local emergency officials who are the first to
respond to an emergency situation.
FISCAL INTERMEDIARY - A private contractor that pays hospital
bills on behalf of Medicare.
FISCAL YEAR (FY)- The 12-month period used for calculating annual
fiscal spending, which parallels the federal government's annual budget
cycle. The U.S. government fiscal year runs from October 1 of the
previous year to September 30 of the calendar year for which the fiscal
year is numbered. States' fiscal years do not always correspond to the
federal fiscal year.
FLEXIBLE SPENDING ACCOUNT/ARRANGEMENT (FSA) - An employee
benefit program that enables the employee to set aside pre-tax money to
be used for certain health care and dependent care expenses.
FORMULARY - A list of selected pharmaceuticals and their
appropriate dosages created by health insurance plans and state Medicaid
programs, which are usually intended to include a broad array of
prescription drugs that are also cost-effective for patient care.
Physicians are often required or urged to prescribe from the formulary
developed by the insurance plans, pharmacy benefit managers or health
maintenance organizations with which they are affiliated.
G
GATEKEEPER/CARE MANAGER - A healthcare professional, usually a
primary care physician, who coordinates, manages, and authorizes all
health services provided to a person covered by a health plan. Unless an
emergency exists, the gatekeeper generally must pre-authorize referrals
to specialists, hospitalizations and lab and radiology tests.
GRADUATE MEDICAL EDUCATION (GME) PAYMENT - Medicare payment to
approved teaching hospitals to cover the costs of training residents.
The GME payment comprises both the direct GME payment, which pays for
the direct costs of training residents, and the Indirect Medical
Education Adjustment, which pays for the increased operating costs of a
teaching hospital. Although IME and direct GME refer to Medicare
payments, Medicaid is also a major funder of graduate medical education.
For more information about GME, see
www.cogme.gov.
GREEN HOUSE® - Small communities of elders and staff set in a
home-like environment that function as long-term care facilities. The
centers provide the assistance and support necessary for each patient,
but focus on social living, rather than on medical care.
GRIEVANCE – In a health policy sense, a grievance is a complaint
filed because of dissatisfaction with the quality of care or customer
service of a health plan. Medicare fee-for-service, Medicare health
maintenance organizations and Medicare Part D prescription drug plans,
as well as Medicaid and most other health plans, have formal procedures
for handling and responding to grievances. If a Medicare beneficiary
files a grievance against a hospital, a Quality Improvement Organization
will review the case and guarantee the patient's stay, possibly
free-of-charge, until the review has been completed. Also see Appeal.
GROUP INSURANCE - Health insurance offered through business,
union trusts or other groups and associations. The policy holder is
generally the employer or other entity. This system of health insurance
is the most common in the United States.
GROUP-MODEL HMO - A health maintenance organization (HMO) that
contracts with a single multi-specialty medical group to provide care
for HMO members. The HMO compensates the group for contracted services
at a negotiated rate, and that group is responsible for compensating its
physicians and contracting with hospitals for care of their patients.
Also see HMO, staff-model HMO and network-model HMO.
GUARANTEE ISSUE- A requirement that health plans cannot reject
coverage for an applicant based on the person’s medical history. Under
the Affordable Care Act, guarantee issue for new coverage and guaranteed
renewability for existing coverage is the law of the land as of January
1, 2014. For those under age 19, the provision is effective as of
September 23, 2010.
GUARANTEED RENEWABILITY – A requirement that health plans cannot
cancel or refuse to renew a person’s health insurance because of the
person’s medical history. See Guarantee Issue.
H
HEALTH COVERAGE TAX CREDITS - A refundable tax credit that is
paid on a monthly basis, or on a yearly basis when a person files their
tax return, to help certain workers, retirees and their families pay for
health insurance premiums.
HEALTH INSURANCE EXCHANGE – A mechanism that creates a single
marketplace facilitating the buying and selling of private health
insurance. Similar to a stock exchange or a farmers market where buyers
and sellers are brought together, the system is intended for
individuals, small businesses, and their employees, while maintaining
existing employer-based access to health insurance. The Affordable Care
Act calls for the creation of exchanges through which individuals who
are U.S. citizens and legal immigrants, and businesses can buy coverage
in every state.
HEALTH INSURANCE PORTABILITY AND ACCOUNTABILITY ACT (HIPAA) -
A 1996 federal law that provides some protection for employed persons
and their families against discrimination in health coverage based on
past or present health. Generally, the law guarantees the right to renew
health coverage, but does not restrict the premiums that insurers may
charge. HIPAA does not replace the states' role as primary regulators of
insurance. HIPAA also requires the collection of certain health care
information by providers and sets rules designed to protect the privacy
of that information. For more information, see
www.hhs.gov/ocr/hipaa/.
HEALTH MAINTENANCE ORGANIZATION (HMO) - A managed care plan that
combines the function of insurer and provider to give members
comprehensive health care from a network of affiliated providers.
Enrollees typically pay limited copayments and are usually required to
select a primary care physician through whom all care must be
coordinated. HMOs generally will not reimburse all costs for services
obtained from a non-network provider or without a primary care
physician's referral. HMOs often emphasize prevention and careful
assessment of medical necessity. See Group-Model HMO, Network-Model HMO
and Staff-Model HMO.
HEALTH OPPORTUNITY ACCOUNT (HOA) - A type of health savings
account for Medicaid beneficiaries created by the Deficit Reduction Act
of 2005 (see glossary). States may deposit annual sums of up to $2,500
per adult and $1,000 per child into the account, to be used to pay for
medical expenses not covered by the high deductible health plan with
which the account is coupled. Compare to Health Savings Account and
Health Reimbursement Arrangement.
HEALTH PLAN EMPLOYER DATA AND INFORMATION SET (HEDIS) - A set of
standardized measures of health plan performance allowing comparisons on
quality, access, patient satisfaction, membership, utilization, finance
and health plan management. HEDIS was developed by employers, health
maintenance organizations (see glossary) and the National Committee on
Quality Assurance.
HEALTH PROFESSIONAL SHORTAGE AREA (HPSA) - A geographic area
determined by the U.S. Public Health Service to have a shortage of
physicians and other health professionals. Physicians who provide
services in HPSAs qualify for a Medicare bonus payment or student loan
forgiveness.
HEALTH REFORM LAW (also known as the Patient Protection and
Affordable Care Act or simply the Affordable Care Act)
-- Law enacted in March 2010, phasing in major expansions in insurance
coverage, changes in insurance rules, and delivery system changes,
phased in over the next several years.
HEALTH REIMBURSEMENT ARRANGEMENT (HRA) - A type of health
insurance plan also known as "health reimbursement account" or "personal
care account," HRAs are tax-preferred accounts with funds established by
employers to reimburse employees for qualified medical expenses; often
HRAs are paired with a high-deductible health plan. An HRA may be used
by an employee to pay for medical coverage until funds are exhausted.
Once the deductible is reached, normal coverage begins. Any unused funds
are rolled over at the end of the year, but do not follow the employee
once he or she changes jobs. Compare to Health Savings Account.
HEALTH SAVINGS ACCOUNT (HSA) - A type of health insurance plan
similar to HRAs (see above), but which is owned by workers. An HSA is a
tax-preferred savings account and is paired with a high-deductible
health plan. Any employer can offer an HSA (or a self-employed
individual can set one up on his or her own), and both employers and
employees can contribute to it. The worker must pay for all services
until the amount of the deductible is reached (in 2009, a minimum of
$1,150 for an individual and $2,100 for family coverage). The worker can
withdraw money from the HSA to pay for medical services under the
deductible. Once the deductible is reached, normal coverage begins. Any
unused funds are rolled over at the end of the year. Unlike HRAs, HSAs
follow an employee when he or she changes jobs. Also see Health
Reimbursement Arrangement and Medical Savings Account.
HIGH-RISK POOL - A health insurance pool organized by states as a
source of coverage for individuals who have been denied health insurance
because of a medical condition, or whose premiums are significantly
higher than the average due to health status or claims experience. The
Affordable Care Act calls for the establishment of a temporary high-risk
pool in every state – run by the state or by the federal government –
with premiums on a par with those in the individual market for persons
without pre-existing medical problems. These pools, which will exist
alongside state high-risk pools already in operation, went into effect
by June 21, 2010 and will end on Jan. 1, 2014. On the later date,
coverage will be vailable to high-risk individuals through state health
insurance exchanges.
HMO – Abbreviation of health maintenance organization
HOME AND COMMUNITY-BASED SERVICES (HCBS)- State-designed HCBS
encompass case management, adult day care, home health aide assistance,
personal care, assisted living services and respite care. Section
1915(c) of the Social Security Act permits the HHS Secretary to approve
Medicaid waivers that allow for long-term care services to be
delivered in the community instead of institutional settings. The
Deficit Reduction Act also created a new capped HCBS option that allows
states to offer these services without having to obtain administrative
waiver approval. See PACE program and Medicaid Section 1915
Waiver. Provisions in Affordable Care Act give states
incentives to expand their HCBS programs to balance spending between
institutional care and HCBS.
HOMEBOUND - Condition required to receive home health care
services under Medicare and generally interpreted to mean that
the beneficiary cannot leave home without excessive effort and does so
only infrequently, for no more than 16 hours per month for non-medical
reasons. The Medicare Prescription Drug, Improvement and
Modernization Act of 2003 authorizes a demonstration project
involving as many as 15,000 beneficiaries in three states, that aims to
clarify and standardize the definition of homebound.
Click here for more information.
HOME HEALTH CARE- Health services rendered in the home, including
skilled nursing care, speech therapy, physical therapy, occupational
therapy, rehabilitation therapy and social services. Medicare
covers some home health care services if the beneficiary is homebound
but does not require more than 35 hours of services per week.
Medicaid pays for home health care services in 12 states.
HOME HEALTH AGENCY (HHA)- Health care provider organization that
renders skilled nursing and health care services in the home. See
Home Health Care and Homebound.
HOSPICE - An organization providing medical, emotional, spiritual
and social help, often in the patient's own home, for those expected to
live less than six months.If a person qualifies for Medicare Part A and
has a terminal illness, Medicare pays for hospice care, including
payment of drugs for symptom control and pain relief, hospice aide and
homemaker service, and spiritual counseling, among other services. For
details on covered services and payment rates,
click here to see an HHS fact sheet.
HOSPITAL INSURANCE (HI) TRUST FUND - The Part A Medicare trust
fund that pays for inpatient hospital services; skilled nursing facility
care for up to 100 days following hospitalization; and some care from
home health providers, hospices and rehabilitation facilities for the
elderly and permanently disabled. Also see Trust Fund.
HYDE AMENDMENT - A federal law first enacted in 1980, and
attached to appropriations bills every year since, that prohibits the
use of federal Medicaid funds for abortion, except for reasons of life
endangerment.
I
INDEMNITY INSURANCE - A health insurance plan that pays providers
on a fee-for-service basis for delivering health care. Consumers face
very few restrictions on provider selection, but may have greater
financial liability in the form of deductibles and coinsurance than in
many managed care plans.
INDEPENDENT PRACTICE ASSOCIATION (IPA) - A physician organization
which typically contracts with a health maintenance organization (HMO,
see glossary) to provide services to the HMO's enrollees. The HMO
usually makes capitated payments to the IPA, but the IPA may choose to
reimburse its physicians on a fee-for-service basis. Physicians can
contract with other HMOs and see other fee-for-service patients.
INDIRECT MEDICAL EDUCATION (IME) ADJUSTMENT - A Medicare payment
supplemental to diagnosis-related group (DRG) payments for each
beneficiary inpatient stay. It is intended to compensate teaching
hospitals for the various costs associated with running an academic
health center that trains and employs large numbers of medical
residents. Many teaching hospitals tend to treat sicker patients with
less insurance coverage, requiring a more costly mix of staff, and may
use more expensive and complex interventions. For more information, see
www.cogme.gov. Also
see Graduate Medical Education Payment and Direct Medical Education
Payment.
INDIVIDUAL MANDATE - A law requiring individuals to obtain
health care coverage, and in some cases, forcing individuals to pay a
penalty if they choose not to participate. The individual mandate of the
Affordable Care Act goes into effect Jan. 1, 2014. Exemptions will
granted for certain people, including American Indians, those with
religious objections and those facing financial hardships.
INPATIENT- A person who is admitted to a hospital, usually for 24
hours or more.
INSTRUMENTAL ACTIVITIES OF DAILY LIVING (IADLs) - Activities
relating to independent living, which include preparing meals, keeping a
budget, purchasing groceries, performing housework and using a
telephone. IADLs refer to skills beyond basic self care, or activities
of daily living.
INTERGOVERNMENTAL TRANSFER (IGT) - Transfer of funds among or
between different levels of government, including state-owned or
operated health care providers, local governments, and non-state-owned
or operated health care providers. The term is most often used in
Medicaid, where transfers of governmental funds to the state Medicaid
agency are used as the non-federal share to draw down federal matching
funds for allowable Medicaid expenditures. States also use IGTs as the
non-federal share to draw down federal matching funds for Medicaid
Disproportionate Share Hospital payments.
INTERMEDIATE CARE FACILITY FOR THE MENTALLY RETARDED (ICF/MR)
- An institution providing diagnosis, treatment or rehabilitation of
individuals with mental retardation or related conditions. ICF/MRs
provide a protected residential setting, ongoing evaluations, 24-hour
supervision and health services. Under Medicaid, states may cover ICF/MR
services.
L
LOCK-IN - Lock-in refers to the period of time an individual is
required to, or agrees to, remain registered with a particular provider
or group of providers, or remain enrolled in a particular health care
plan.
LONG-TERM CARE (LTC) - Ongoing health and social services
provided for individuals who need continuing assistance with activities
of daily living and/or instrumental activities of daily living (see
glossary). Services can be provided in an institution, the home or the
community, and include informal services provided by family and friends
as well as formal services provided by professionals or agencies.
Medicaid is the primary payer of LTC services in nursing homes.
LONG-TERM CARE PARTNERSHIP PROGRAM - A program that combines
private LTC insurance with special access to Medicaid. This program
encourages qualified individuals to purchase a limited, and therefore
more affordable, amount of LTC insurance coverage, with the assurance
that they could receive additional LTC services through the Medicaid
program as needed after their insurance coverage is exhausted, without
having to deplete their assets to the level typically required in order
to be Medicaid eligible.
LOSS RATIO – See Medical Loss Ratio
M
MANAGED CARE ORGANIZATION (MCO) - A health care organization,
such as a health maintenance organization (HMO) or preferred provider
organization (PPO), that contracts to provide medical services to a
group of enrollees in exchange for capitated monthly premiums. Payments
to physicians and other practitioners in HMOs are often lower than
fee-for-service payments. Medicare Advantage includes HMOs, preferred
provider organizations (PPO) and regional PPOs.
MANDATE - Used in two senses in health policy discussions. (1)
Employer or individual mandate, in which a government body imposes a
requirement on some employers to help pay for insurance coverage for
their workers (and perhaps their families), and/or on certain
individuals to obtain coverage. (2) State mandate, a requirement imposed
by states on insurance companies to include, as part of any health
insurance policy they sell, coverage for a specific service, such as
well baby care, or provider, such as psychologists or optometrists.
MARKET BASKET INDEX - An index of the annual change in the prices
of a selection of goods and services providers used to produce health
services. Also referred to as an input price index.
MEANS-TESTING - Determining eligibility for government benefits
based on an individual's lack of means, as measured by income and/or
assets. Under current Medicaid eligibility guidelines,
means-testing may differ for different eligibility groups (see
Categorical Eligibility). The Medicare Prescription Drug
Improvement and Modernization Act of 2003 introduced a form of
means-testing in Medicare, which now sets higher premiums for
higher-income seniors and provides more generous drug benefits to
lower-income beneficiaries.
MEDICAID - Public health insurance program that provides coverage
for low-income persons for acute and long-term care. It is financed
jointly by state and federal funds (the federal government pays at least
50 percent of the total cost in each state) and is administered by
states within broad federal guidelines. See
Chapter 8, Medicaid, for more.
MEDICAID 1115 WAIVER - Under Section 1115(a) of the Social
Security Act, the Secretary of Health and Human Services may waive most
provisions of Medicaid law for demonstrations "likely to assist in
promoting the objectives" of the program. Under long-standing policy,
these waivers must be cost-neutral. Demonstration waivers may be granted
for research purposes, to test a program improvement, or investigate a
new way of delivering services.
MEDICAID 1915 (b) AND (c) WAIVER - Under Section 1915(b) of the
Social Security Act, the Secretary of Health and Human Services may
waive any provision of Medicaid law that prevent states from limiting
beneficiaries' ability to choose providers. Section 1915(b) waivers are
often sought by states that hope to control costs through managed care.
Under Section 1915(c), the Secretary can allow states to obtain matching
funds for long-term care services provided to Medicaid beneficiaries in
home and community-based settings. Waivers are effective for two years.
MEDICAL HOME – see Patient-Centered Medical Home
MEDICAL IRA - See Medical Savings Account
MEDICAL LOSS RATIO - The ratio of money paid out by an insurer
for claims, divided by premiums collected for a particular type of
insurance policy. Low loss ratios indicate that a small proportion of
premium dollars was paid out for benefits, while a high loss ratio
indicates that a high percentage of the premium dollars was paid out for
benefits. The Affordable Care Act sets minimum medical loss ratios for
health plans effective Jan. 1, 2011.
MEDICAL SAVINGS ACCOUNT (MSA) - A health insurance option
consisting of a high-deductible insurance policy coupled with a -
tax-preferred savings account. MSA policies, enacted in 1996, have been
largely replaced by health savings accounts.
MEDICAL UNDERWRITING - See Underwriting
MEDICALLY NECESSARY - Description of services or supplies
required to preserve and maintain the health status of a patient in
accordance with the area standards of medical practice. Whether or not
medically necessary services are being denied to patients enrolled in
some public and private managed care plans can be an issue of
contention. To resolve these issues, many plans have appeals and
grievance processes.
MEDICALLY NEEDY - An optional Medicaid category in which
states can cover individuals and families who quality for coverage
because of high medical expenses, usually hospital or nursing home care.
To qualify, individuals must be categorically eligible and their monthly
incomes minus accumulated medical bills must be below state income
limits for the Medicaid program. This allows Medicaid coverage for
people who have extensive health care needs but too much income to be
eligible for Medicaid. Also see Spend-Down.
MEDICARE - Federal health insurance program for virtually all
persons age 65 and older, and permanently disabled persons under age 65,
who qualify by receiving Social Security Disability Insurance.
See
Chapter 7, Medicare, for more.
MEDICARE ADVANTAGE - A part of Medicare designed to offer
beneficiaries a choice of managed care and other private plan options,
such as Medicare health savings accounts. Also called Part C of
Medicare (and formerly known as Medicare+Choice), Medicare Advantage
encompasses health maintenance organizations (HMOs), preferred provider
organizations (PPOs), Medicare HSAs, regional PPOs, and other options.
Not all options are available in all areas.
MEDICARE ADVANTAGE PRESCRIPTION DRUG PLAN (MA-PD) - Medicare
Part D prescription drug coverage that is sponsored by a Medicare
Advantage plan.
MEDICARE PART A - Also known as the
Hospital Insurance (or HI) program, Part A of the Medicare
program covers inpatient hospital care, skilled nursing care for up to
100 days after a hospitalization, home health and hospice care.
It is funded by a portion of the wage tax – 2.9 percent, with employers
and employees each paying 1.45 percent.
MEDICARE PART B - Also known as
Supplementary Medical Insurance (or SMI), Part B of Medicare covers
physician services, outpatient care and home health care after
100 visits. It is funded partly by premiums paid by beneficiaries.1
The rest comes from the federal government’s general revenue.
MEDICARE PART
C -- Medicare Advantage
MEDICARE PART D – See Medicare Prescription Drug, Improvement
and Modernization Act of 2003 below.
MEDICARE+CHOICE - See Medicare Advantage
MEDICARE PRESCRIPTION DRUG, IMPROVEMENT & MODERNIZATION ACT OF
2003 (MMA) - Legislation signed into law in December 2003 that
provides seniors and disabled individuals on Medicare with a
prescription drug benefit, delivered through private stand-alone
prescription drug plans or managed care plans integrating Part A
and Part B benefits (Medicare Advantage). The law expanded
the array of Medicare managed care plans and changed payment
methodologies.
Click here for more information.
MEDICARE SAVINGS PROGRAM (MSP) - The program provides assistance
through Medicaid with Medicare premiums - and sometimes cost-sharing
requirements - to Medicare beneficiaries of limited income and resources
who do not qualify for full Medicaid benefits. The program encompasses
qualified Medicare beneficiaries (QMBs), specified low-income
Medicare beneficiaries (SLMBs) and other groups of beneficiaries who
need help with cost-sharing to access services.
Click here
for more information.
MEDIGAP INSURANCE/MEDICARE SUPPLEMENTAL INSURANCE - Medigap
policies are sold by private insurance companies to fill "gaps" in
fee-for-service Medicare. Except in Minnesota, Massachusetts and
Wisconsin, there are 10 standardized policy designs, known as Plans A
through J. Plans H, I and J include limited drug coverage. No new
Medigap policies that include drug coverage are now being be sold.
Beneficiaries with existing Medigap policies that include drug coverage
may maintain them if they wish. However, they may be subject to late
enrollment penalties if they later want Part D drug benefits.
Click here
for more information.
MENTAL HEALTH PARITY ACT - An act requiring group health plans
with more than 50 employees to ensure that financial requirements and
treatment limitations applicable to mental health/substance use disorder
benefits are no more restrictive than the predominant requirements and
limitations placed on substantially all medical/surgical benefits.
MINI-MED - Health
plans, often "offered" to employees in typically low to minimum wage
jobs, such as fast food workers and those in big box retailing, i.e.,
Wal-Mart, Target and the like. Perhaps the most widely known is
the plan offered by McDonalds to its non-managerial employees.
McDonald’s offers its hourly workers two different health care plans,
which are known as “mini-med” plans. In one, workers can pay about $730
a year for benefits of up to $2,000. In the other, they can pay about
$1,660 a year for benefits of up to $10,000. The problem: Mini-med plans
force people to drain their savings accounts for dozens of common
medical problems. They also force hospitals and other providers to let
some bills go unpaid, which drives up costs for everyone else.
MODIFIED COMMUNITY RATING – A method for setting health
insurance premiums for everyone in a state taking into account
demographic variables, but not the applicant’s medical history. Contrast
with Community Rating and Experience Rating.
MORBIDITY - A determination of the incidence and severity of
sicknesses and accidents in a well-defined class of persons.
MORTALITY - An actuarial determination of the death rate at each
age as determined from prior experience.
MULTIPLE EMPLOYER WELFARE ASSOCIATION (MEWA) - A group of
employers who band together for purposes of purchasing group health
insurance, often through a self-funded approach. MEWAs are sometimes
exempt from state benefit mandates, taxes and other regulations.
N
NATIONAL ASSOCIATION OF INSURANCE COMMISSIONERS (NAIC) - A
nonprofit association whose members comprise the insurance commissioners
of the individual states and territories. NAIC members are elected or
appointed state government officials who regulate the conduct of
insurance agencies and agents. NAIC was delegated significant
responsibilities under PPACA including developing uniform definitions
for calculating medical loss ratios and assisting HHS with establishing
rate review procedures.
NATIONAL DIABETES
EDUCATION PROGRAM (NEDP) - A joint effort of the CDC and the
National Institutes of Health, NDEP supports communities, providers and
worksites in educating individuals and families about pre-diabetes and
diabetes prevention. For more information, see
http://ndep.nih.gov or
www.cdc.gov/diabetes/ndep.
NETWORK-MODEL HMO
- A health maintenance organization (HMO) that contracts with
more than one independent physician group to provide health services.
The providers may see patients who are not members of the HMO. Also see
HMO, Group-Model HMO and Staff-Model HMO.
NEVER EVENT -
28 occurrences that the National Quality Forum has identified as events
that should never happen in a hospital and can be prevented. These
events include surgical events, product or device events, and criminal
events. The Centers for Medicare and Medicaid Services (CMS) announced
in January 2009 that Medicare would stop paying for three never events –
wrong invasive procedures, invasive procedures performed on the wrong
body part and invasive procedures performed on the wrong patient.
NURSE PRACTITIONER (NP/RNP) - A registered nurse with advanced
academic and clinical experience who diagnoses and manages most common
and many chronic illnesses, either independently or as part of a health
care team. A nurse practitioner provides some care previously offered
only by physicians and in most states has the ability to prescribe
medications.
O
OFFICE OF CONSUMER INFORMATION AND INSURANCE OVERSIGHT--
Created by PPACA to ensure compliance with the new insurance market
rules, this agency with the U.S. Dept. of Health and Human Services
oversee the new medical loss ratio rules and assist states in reviewing
insurance rates. In addition, it is charged with providing guidance and
oversight for the state-based insurance exchanges and administers the
temporary high-risk pool program and the early retiree reinsurance
program. It also compiles and maintains data for an internet portal
providing information on insurance options. It comprises four offices:
the Office of Oversight, the Office of Insurance Programs, the Office of
Health Insurance Exchanges, and the Office of Consumer Support.
ON LOK PROGRAM - A San Francisco project that uses an HMO
model to provide all acute care and long-term care services needed by a
frail elderly population at risk of nursing home placement.
Click here for more information. Also see Program of All-Inclusive
Care for the Elderly.
OPEN ENROLLMENT - The period of time during which health
insurance coverage options are offered to a specified population,
regardless of health status and without medical screening. Open
enrollment periods are characteristic of some Blue Cross-Blue Shield
plans and health maintenance organizations, and all plans in the Federal
Employees Health Benefits Program.
OPEN PANEL/OPEN ACCESS - A self-referral arrangement allowing
health plan enrollees to see participating providers for specialty care
without a referral from a primary care physician or other doctor.
ORGANIZED DELIVERY SYSTEMS - Networks of providers and payers
that provide care and compete with other systems for enrollees. Systems
may include hospitals, physicians and other providers and sites offering
a full range of preventive and treatment services. Also known as
coordinated care networks, community care networks and integrated health
systems.
OUT-OF-POCKET CAP/MAXIMUM - An annual limit on how much the patient has
to pay in deductibles, coinsurance and copayments. Medicare Parts
A, B and C do not have an out-of-pocket cap, while Part D does: when
total out-of-pocket prescription drug expenses reach $5,916.25 (in
2009), Medicare begins to pay 95 percent of the beneficiary's drug costs
through the end of the year. Also called a "stop-loss" provision.
OUTCOMES RESEARCH - Research that attempts to evaluate particular
health services by tracking and analyzing clinical results (e.g., death,
illness, ability to function) of various treatments.
OUTPATIENT - A person receiving medical services who has not been
admitted to a hospital.
OUTPATIENT HOSPITAL SERVICES- Services provided to a hospital
outpatient. They are covered by Part B for Medicare beneficiaries. For
more information, see
Chapter 7, Medicare.
P
PARTIAL CAPITATION - An insurance arrangement where the payment
made to a health plan is a combination of a capitated premium and a
payment based on actual use of services. The proportions specified for
these components determine the insurance risk faced by the plan.
Sometimes called "ambulatory capitation."
PATIENT-CENTERED MEDICAL HOME -- An approach to providing
comprehensive primary care for individuals through creating a setting
that facilitates partnerships between individual patients and their
personal physicians. This approach to care is aided by registries,
information technology, health information exchange and other means to
assure that patients get the indicated care when and where they need and
want it in a culturally and linguistically appropriate manner. To see
more, see the
NCQA description.
PATIENT-CENTERED OUTCOMES RESEARCH INSTITUTE - A private,
nonprofit institute created in the health reform law (PPACA) to set an
agenda for, and oversee the conduct of, comparative effectiveness
research in the U.S.
PATIENT PROTECTION AND AFFORDABLE CARE ACT
(a BFD)- Law enacted in March 2010, phasing in major expansions in
insurance coverage, changes in insurance rules, and delivery system
changes. Known informally as the Affordable Care Act.
PATIENT SAFETY ORGANIZATION (PSO) - An organization that works
to improve patients' safety and quality of care, by developing and
disseminating patient safety data. PSOs can be public, such as state
health agencies that collect hospital data, or private, such as The
Joint Commission (formerly Joint Commission on Accreditation of
Healthcare Organizations) which evaluates and accredits nearly 15,000
health care organizations across the U.S.
PAY FOR PERFORMANCE (P4P) - A method of paying health care
providers differing amounts based on their performance on measures of
quality and efficiency. Payment incentives can be in the form of bonuses
or financial penalties.
PAY OR PLAY - See Employer Contribution Requirement
PAYROLL TAX - A flat percentage tax collected on salaries and
wages. A payroll tax of 7.65 percent on both employers and employees
finances Social Security cash benefits and Medicare Part A
hospital services. Of that 7.65 percent, 1.45 percent each, or a total
of 2.9 percent of payroll with both employer and employee contributions,
is allocated for Medicare.
PEER REVIEW ORGANIZATION (PRO) - See Quality Improvement
Organization
PHARMACY BENEFIT MANAGER (PBM) - A company that contracts with
insurers and employers to manage the prescription drug benefit for
enrollees or employees. The vast majority of managed care plans
use PBMs.
POINT-OF-SERVICE PLAN (POS) - A managed care plan that
combines features of both prepaid and fee-for-service insurance. POS
plan enrollees decide whether to use network or non-network providers at
the time care is needed, but usually are subject to reduced coverage and
larger copayments for using non-network providers.
POVERTY LEVEL - See Federal Poverty Guidelines
PRACTICE GUIDELINES/PARAMETERS - A statement of the known
benefits, risks and costs of particular courses of medical action,
developed to give physicians information about treatment alternatives.
PRE-EXISTING CONDITION - A physical or mental condition of an
individual which is known to the individual before an insurance policy
is issued. Insurers may choose not to cover treatment for such a
condition, at least for a period, may raise rates because of it, or may
deny coverage altogether.
PREFERRED PROVIDER ORGANIZATION (PPO) - A health care delivery
system through which a number of providers contract to serve health plan
enrollees on a fee-for-service basis at discounted fees. Providers agree
to PPO discounts in the hope of gaining more patients. Patients may use
any provider without a referral, in network or out, but have a financial
incentive - for example, lower coinsurance payments - to use doctors on
the preferred list.
PREMIUM - The cost of health plan coverage, not including any
required deductibles or copayments.
PREMIUM ASSISTANCE - The use of federal funds available through
public health coverage programs - especially Medicaid and CHIP
- to purchase or help purchase private insurance.
PREMIUM SUPPORT - A health benefit model that is considered by
its designers to be a hybrid of the defined contribution and defined
benefit approaches. This model would require general categories of
health services to be covered, but benefits could be added or deleted
within limits. The employer or government would then contribute a set
amount of the premium for the purchased plan. Plans could set premiums
at whatever dollar level they choose, with beneficiaries liable for any
costs above the employer or government contribution. A Medicare
demonstration designed to test a model similar to premium support began
in 2010.
PREVENTIVE HEALTH SERVICES - Services aimed at preventing a
disease from occurring, or preventing or minimizing its consequences.
This includes care aimed at warding off illnesses (immunizations), at
early detection of disease (Pap smears), and at stopping further
deterioration (cholesterol-lowering medication).
PRIMARY CARE - Care at "first contact" with the health care
system, including an array of non-specialist services provided by
physicians, nurse practitioners, or physician's assistants - more
simply, the care that most people receive for most of their problems
that bother them most of the time.
PRIMARY CARE CASE MANAGEMENT, INITIATIVE, OR CLINICIAN - (PCCM/PCI/PCC)
- A Medicaid managed care program in which an eligible individual
may use services only with authorization from his or her assigned
primary care provider. That provider is responsible for locating,
coordinating, and monitoring all primary and other medical services for
enrollees. Those services are usually paid on a fee-for-service basis.
PRIMARY CARE PHYSICIAN - A physician - general practitioner,
family physician, pediatrician, some internists or OB/GYNs - who serves
as the patient's first point of contact with the health care system and
coordinates the patient's medical care.
PROGRAM OF ALL-INCLUSIVE CARE FOR THE ELDERLY (PACE) - Originally
a Medicare demonstration project that replicated the model of managed
care developed by On Lok Senior Health Services in San Francisco,
California. The Balanced Budget Act of 1997 expanded PACE into a
national, permanent program and created a Medicaid PACE option. PACE
targets frail community-dwelling elderly, most of whom are dually
eligible for Medicare and Medicaid. Core services include adult day
care, social support, home health, hospital care, nursing home care, and
case management that integrates acute and long-term care services. PACE
is financed through capitated Medicare and Medicaid payments to the
provider. Click
here for more information. Also see On Lok Program.
PROSPECTIVE PAYMENT SYSTEM (PPS) - A method used by Medicare to
pay for many services, including inpatient and outpatient hospital
services as well as services provided at skilled nursing and
rehabilitation facilities. Payment rates are linked to diagnosis and
determined before services are rendered, rather than being based on
actual costs or charges of a specific facility. Rates are intended to
cover treatment costs for a typical patient with a given diagnosis and
are adjusted for factors like wages and indigent care.
PROVIDER - Any health care professional or institution that
renders a health service or provides a health care product. Major
providers are hospitals, nursing homes, physicians and nurses.
PUBLIC CHARGE - A term used by immigration officials to describe
someone who is dependent on the government for subsistence. Being
classified as a public charge can damage an immigrant's ability to
become a permanent resident, to leave and reenter the U.S., or even to
remain in the country. Some immigrants do not enroll themselves or their
children into health care programs such as Medicaid and CHIP for fear of
being labeled a "public charge," although receipt of CHIP and most
Medicaid services is not considered in determining public charge status.
PUBLIC HEALTH - The protection and improvement of population
health by organized community effort. Public health activities are very
broad and include immunization, sanitation, preventive medicine, disease
control, education about reducing personal risks, occupational health
and safety, pollution control, water safety, food safety, epidemiology,
etc.
PURCHASING POOL - A group of people, businesses or associations
who come together to enhance their bargaining power and negotiate lower
premiums from health insurance plans than they could on their own, while
also pooling risks across sick and healthy individuals.
Q
QUALIFIED MEDICARE BENEFICIARY (QMB) - A person who is eligible
for Medicare, has an income below 100 percent of the federal
poverty level and has limited assets, is eligible to receive
cost-sharing assistance if enrolled in the Qualified Medicare
Beneficiary program. Under the QMB program, state Medicaid
agencies are required to pay the cost of Medicare Part A and B premiums,
deductibles, and coinsurance.
Click here
for more information.
QUALITY-ADJUSTED LIFE YEARS (QALYs) - Years of life saved by a
medical technology or service, adjusted to reflect the health quality of
those years (as determined by some evaluative measure). QALYs are the
most commonly used unit to express results in certain cost-effectiveness
analyses. A year of perfect health is considered equal to 1.0 QALY.
QUALITY IMPROVEMENT ORGANIZATION (QIO) PROGRAM - Under the
Quality Improvement Organization Program, Medicare contracts with 53
QIOs, each responsible for each state, territory and the District of
Columbia, to monitor hospital use and the quality of care received by
Medicare patients. For example, QIOs examine and analyze hospital
admissions of Medicare patients to assess the appropriateness of
services, based on the severity of the patients' illness and the
intensity of the services needed and received.
Click here for more information.
R
RATING - The process of evaluating, or underwriting, a group or
individual to determine a health insurance premium rate relative to the
financial risk of needing healthcare the person or group presents. Key
components of the rating formula include age, sex, location and plan
design.
RATING BANDS - Amounts by which insurance rates for a specific
class of insured individuals may vary. All states have laws regulating
insurer rating practices, and many states periodically update these laws
with small group market reform proposals to restrict or loosen allowable
variations.
REFERRAL - A primary care doctor's written permission for a
patient to see a certain specialist or to receive certain services.
Required by some managed care health plans.
REFUNDABLE TAX CREDIT- A way of providing a tax subsidy to an
individual or business, even if no taxes are owed (see glossary, tax
credit). If a person owes no tax, the government sends the person (or a
third party) a check for the amount of the refundable tax credit.
REIMPORTATION - The process by which individuals or groups
purchase pharmaceuticals from other countries that were originally
produced in the U.S. and exported for consumption abroad. Because many
other countries have lower drug prices than the U.S., this process can
save consumers money on drugs for personal use. Reimportation can occur
either by traveling to another country to purchase drugs (e.g., driving
to Canada), or by purchasing drugs over the Internet or by mail from
foreign pharmacies. Though traditionally not the subject of law
enforcement, most reimportation violates U.S. federal drug safety laws.
REINSURANCE/RISK CONTROL INSURANCE – A practice allowing an
insurance company (the insurer) to transfer a portion of its risks to
another insurer (the reinsurer). This practice does not affect
policyholder rights in any way, and the original insurer remains liable
to the policyholders for benefits and claims.
RELATIVE VALUE SCALE (RVS) - An index that assigns weights to
each medical service; the weights represent the relative amount to be
paid for each service. To calculate a fee for a particular service, the
index for that service is multiplied by a constant dollar amount (known
as the conversion factor). Medicare uses an RVS to calculate payments to
physicians.
RESOURCE-BASED RELATIVE VALUE SCALE (RBRVS)- The way Medicare
determines how much it will pay physicians, based on the resource costs
needed to provide a Medicare-covered service. The RBRVS divides the cost
of providing services into three components: physician work, practice
expense and professional insurance. The Medicare payment to physicians
is determined by multiplying the combined costs by a conversion factor
set by the Centers for Medicare and Medicaid Services, adjusted for
geographical differences in the cost of resources. Physician work
typically accounts for 50 percent of the value while practice expense
accounts for 45 percent.
RESPITE CARE - Short-term personal care given to a frail elder or
person with disabilities to substitute for assistance usually provided
by a family caregiver.
RISK - The probability of financial loss, relative to the
probability of having to provide services to a patient or patient
population at a cost that exceeds the payments received. Under
capitation payment systems, providers share the risk that is borne by
insurers.
RISK ADJUSTMENT - Increases or reductions in payment made to a
health plan on behalf of a group of enrollees to compensate for health
care expenditures that are expected to be higher or lower than average.
RISK SELECTION - Enrollment choices made by health plans - or by
enrollees - on the basis of perceived risk relative to the premium to be
paid.
RISK SHARING - A method by which the financial risk of covering a
group of enrollees is shared by plan sponsors and purchasers, typically
managed care organizations and states. In contrast, indemnity plans
assume all risk of providing care paid for through insurance premiums
which belong solely to the insurance company.
S
SAFETY NET PROVIDERS - Providers that have a primary focus of
servicing low-income and uninsured people. They include community and
migrant health centers and public hospitals. See community health
center.
SECTION 125 PLAN -- A Section 125 plan provides participants
an opportunity to receive certain benefits, such as reimbursement for
some out-of-pocket medical expenses, on a pretax basis. It is a separate
written plan maintained by an employer for employees that meets the
specific requirements of, and regulations of, Section 125 of the
Internal Revenue Code.
SECTION 1115 WAIVER - See Medicaid 1115 Waiver
SECTION 1915 (a) AND (b) WAIVER - See Medicaid 1915 (a) and (b)
Waiver
SELF-EMPLOYED DEDUCTION FOR HEALTH INSURANCE - Self-employed
taxpayers and their families can deduct all their payments for health
insurance, including insurance premiums, when figuring their annual
income for tax purposes, to the extent these payments exceed 7.5 percent
of adjusted gross income.
SELF-INSURANCE - Large and medium-size companies often assume all
or most financial risks of providing health insurance to their workers,
as opposed to purchasing insurance coverage from commercial carriers
(and having the carrier assume all risk). Claims processing is often
handled through an administrative services contract with an independent
organization, often an insurance company.
SEQUENCED TREATMENT ALTERNATIVES TO RELIEVE DEPRESSION (STAR*D)-
Funded by the National Institute of Mental Health, STAR*D was the
largest depression study in the U.S. and examined outcomes of a range of
treatments aimed at helping depressed patients become symptom-free.
Click here for more information.
SINGLE PAYER SYSTEM - A proposed reorganization of the health
care system, either at the national or state level, which would
designate one entity (usually the government) to function as the central
purchaser of health care services. Canadian provinces operate health
insurance coverage for residents under this system.
SKILLED NURSING FACILITY (SNF) - An institution that offers
skilled services similar to those given in a hospital, such as
intravenous injections and physical therapy given by professional staff,
to aid rehabilitation following hospitalization of patients who have
been discharged. SNFs differ from nursing homes or nursing facilities,
which are intended primarily to support elderly and disabled individuals
in the tasks of daily living (custodial care). Medicare does not
cover custodial care in nursing homes; however, Medicare does cover
skilled nursing care, rehabilitation and associated custodial care in
SNFs. Medicaid covers care in all Medicaid-certified nursing facilities.
SMALL BUSINESS HEALTH PLAN (SBHP)- Purchasing pools for small
employers that have frequently been the subject of congressional
proposals, SBHPs would include trade, industry and professional
associations as well as 'cooperative' corporations or chambers of
commerce. Known in other proposals as association health plans (see
glossary), SBHPs have generated controversy because they would be exempt
from some state laws regulating health insurance.
SMALL GROUP MARKET REFORM - Generally refers to laws, regulations
and proposals that are designed to simplify rules for small employers
(typically 50 workers or fewer) purchasing health insurance. While most
regulation of health insurance is done at the state level, the 1996
Health Insurance Portability and Accountability Act made some key
reforms.
SOCIAL SECURITY DISABILITY INSURANCE (SSDI) - Financed with
Social Security taxes, SSDI provides assistance to people who are
permanently disabled and unable to work, and who previously worked and
paid Social Security payroll taxes. Although the number of work credits
required to qualify for SSDI depends on the age of disability onset, one
must typically have 40 credits, of which 20 must be from the last 10
years (four work credits can be earned per year). The size of the
monthly benefit depends on the beneficiary's earnings record. Widows,
widowers and adults who are blind or disabled since childhood are also
eligible for SSDI.
SOCIALIZED MEDICINE - A system of health care in which all
health personnel and health facilities, including doctors and hospitals,
work for the government and draw salaries from the government. Doctors
in the U.S. Veterans Administration and the Armed Services are paid this
way. Veterans and U.S. military hospitals are also supported this way.
Examples also exist in Great Britain and Spain.
SPECIFIED LOW-INCOME MEDICARE BENEFICIARY (SLMB) - A person who
is eligible for Medicare, has an income of between 100 to 120
percent of the federal poverty level and has limited assets, is eligible
to receive cost-sharing assistance if enrolled in the Specified
Low-Income Medicare Beneficiary program. Under the SLMB program, state
Medicaid agencies are required to pay the beneficiary's Part B premiums,
but not deductibles or copayments. Also see Qualified Medicare
Beneficiary.
Click here
for more information.
SPEND-DOWN - Process by which individuals in many states can
qualify for Medicaid because high medical expenses, usually
hospital or nursing home care, reduce their monthly income to below
state income limits for the Medicaid program. The amount that each
individual must "spend down" is determined at the time eligibility is
determined. Also see Medically Needy.
STAFF-MODEL HMO - A health maintenance organization
(HMO) that delivers health services through salaried physicians who are
employed by the HMO exclusively to care for HMO enrollees. Also see HMO,
Group-Model HMO and Network-Model HMO.
STATE HEALTH INSURANCE ASSISTANCE PROGRAM (SHIP) - A federal
program that provides funding to states to provide Medicare
beneficiaries and other consumers with free health insurance counseling
and assistance.
Click here for more information.
STATE MANDATE - State coverage laws requiring private insurers to
cover specific services (such as well-baby care) or reimbursement for
specific providers (such as psychologists). The Employee Retirement
Income Security Act generally exempts self-insured companies from these
requirements.
STATE PHARMACY ASSISTANCE PROGRAM (SPAP)- State-funded program
providing pharmacy benefits to seniors and other low-income groups.
Before the enactment of Medicare Part D, 22 states funded SPAPs
while 6 states operated waiver programs funded jointly by state and
federal governments through Medicaid (see Medicaid 1115 Waiver). With
Part D in operation, most states have begun providing wrap-around
benefits to coordinate and ease the enrollment of their Medicare
beneficiaries by, for example, covering deductibles, co-insurance or the
gap in Medicare Part D coverage.
Click here for more information.
STEM CELLS - Primitive cells derived from human embryos
(embryonic stem cells) and some adult tissue (adult stem cells). They
are undifferentiated cells, meaning they have the capacity to develop
specialized functions when grown in the appropriate laboratory
environment. Scientists create stem cell "lines," or cell cultures, used
in disease research.
STOP-LOSS - See Out-of-Pocket Cap
SUBSTANCE ABUSING - A maladaptive pattern of using certain
drugs, alcohol, medications, and toxins that leads to clinically
significant impairment or distress.
SUBSTANCE DEPENDENCE – When a person continually uses a
particular substance resulting in compulsive substance-taking behavior,
tolerance for the substance, and withdrawal symptoms if the person stops
using the substance.
SUPPLEMENTAL MEDICAL INSURANCE - Any private health insurance
plan held by a Medicare beneficiary that is purchased to fill in "gaps"
in traditional Medicare coverage, or to finance cost-sharing
requirements, e.g., Medicare's hospital deductible. Among the most
common types of supplemental insurance are some employer-sponsored
retiree coverage and Medigap insurance (see glossary).
SUPPLEMENTAL SECURITY INCOME (SSI)- A federal income support
program for low-income disabled, aged and blind individuals. Eligibility
for SSI monthly cash payments does not depend on previous employment or
contributions to a trust fund. Eligibility for SSI usually confers
eligibility for Medicaid.
SUPPLEMENTARY MEDICAL INSURANCE (SMI) TRUST FUND - The
Medicare trust fund that pays for physician procedures and
treatments delivered in hospital outpatient departments, ambulatory
surgical centers, and other non-hospital facilities; most home health
care services; durable medical equipment such as wheelchairs; and the
new prescription drug benefit. The SMI account is financed with
beneficiary premiums (25 percent) and general revenues (75 percent).
SUSTAINABLE GROWTH RATE (SGR) - The Balanced Budget Act of 1997
established the formula for determining annual SGR targets for
physicians' services under Medicare. The SGR is intended to control
growth in total Medicare expenditures for physician services. If
expenditures exceed the SGR target, the fee schedule update is
decreased. Four factors are used to calculate the SGR: (1) average
percent change in physician fees; (2) change in the average number of
fee-for-service beneficiaries; (3) 10-year average annual growth in GDP
per capita; and (4) change in expenditures due to new laws or
regulations.
T
TAX CREDIT - A flat amount that can be subtracted from taxes
owed. Under some health care reform proposals, tax credits would be
given to moderate-income individuals/families to subsidize health
insurance premiums. A tax credit is more progressive in its impact than
a tax deduction of the same amount, since the value of a deduction is
greater for those whose tax rates (and usually incomes) are higher.
TAX DEDUCTION - An amount that can be subtracted from taxable
income if spent on a specific purpose. Currently, businesses and the
self-employed can deduct the cost of health insurance provided to
employees, but health expenses (including insurance) are a deduction for
families with group health insurance only after they reach 7.5 percent
of income.
TAX PREFERENCE (FOR HEALTH BENEFITS) - Employer-paid health
benefits are treated under federal tax law as a deductible business
expense for the employer, and excluded from taxable income for the
worker. This creates incentives for some employers and workers to prefer
extra compensation in the form of more health coverage rather than
wages.
TEMPORARY ASSISTANCE FOR NEEDY FAMILIES (TANF) - The block grant
program that, in 1996, replaced categorical welfare assistance such as
Aid to Families with Dependent Children. Under TANF, time limits are set
for cash benefits, and recipients are expected to accept work or be
enrolled in training programs. TANF was reauthorized in 2005 as part of
the DRA with $16.4 billion in annual funding through FY 2010.
Click
here for more information.
TERTIARY CARE - Health care services provided by highly
specialized providers such as neurosurgeons, thoracic surgeons, and
intensive care units. These services often require highly sophisticated
technologies and facilities.
THERAPEUTIC SUBSTITUTION - Replacement of one drug with another
drug from the same therapeutic class that the Food and Drug
Administration has determined to be equivalent - the substitute has the
same active ingredient with the same absorption rate as the original
drug. Often, this results in prescribing the less costly compound.
THIRD PARTY ADMINISTRATOR (TPA) - A professional firm that
provides administrative services to employers who want to self-insure
their employees. The TPA does not underwrite the financial risk of
providing coverage.
THIRD PARTY PAYER - Organization, public or private, that pays or
insures medical expenses on behalf of enrollees. An individual pays a
premium, and the payer organization pays providers' actual medical bills
on the individual's behalf. Such payments are called third-party
payments and are distinguished by the separation among the individual
receiving the service (the first party), the individual or institution
providing it (the second party), and the organization paying for it
(third party).
TRADE ACT HEALTH INSURANCE SUBSIDY- Premium subsidy program that
covers a portion of the cost of health insurance for early retirees,
their families and other workers who have lost their employer-sponsored
health coverage as a consequence of company failure due to trade
practices or bankruptcy. The subsidy to former workers is provided in
the form of a federal tax credit either to be claimed when the income
tax return is filed, or sent directly to the beneficiary's health
insurance provider each month.
TRANSITIONAL MEDICAL ASSISTANCE (TMA) - Medicaid coverage for up
to one year for families leaving welfare to become self-supporting
through work. During this transition period, states are required to
continue Medicaid benefits even if earnings increase.
Click
here for more information.
TRIAGE - The classification of sick or injured persons according
to severity in order to direct care and ensure the efficient use of
medical and nursing staff and facilities.
TRICARE - Program providing medical care to the dependents of
active duty members of the military and to retired members of the
military. Formerly known as the Civilian Health and Medical Program
(CHAMPUS), the program is run by the Department of Defense. For more
information, see
www.health.mil/.
TRUST FUNDS - Federal trust funds are created in the U.S.
Treasury to account for all program income, such as Social Security and
Medicare taxes, and disbursements, such as benefit payments and
program administrative costs. Revenues not needed in a particular year
are invested in special non-marketable government securities; therefore,
the trust funds represent the total value, including interest, of all
prior program annual surpluses and deficits. There are two Social
Security trust funds: the Old-Age and Survivors Insurance Trust Fund,
which pays retirement and survivors benefits, and the Disability
Insurance Trust Fund, which pays for disability benefits. There are also
two Medicare trust funds: the Hospital Insurance (HI) Trust Fund, which
pays for inpatient hospital and related care, and the Supplementary
Medical Insurance (SMI) Trust Fund, which pays for physician and
outpatient services. Medicare Part D prescription drug expenditures are
paid out of the SMI Trust Fund. See HI Trust Fund and SMI Trust Fund in
glossary.
U
UNBUNDLING - Separately billing for medical services that might
otherwise be priced together ("bundling"). For claims processing, this
includes providers billing separately for health care services that
should be combined according to industry standards or accepted coding
practices.
UNCOMPENSATED CARE - Care rendered by hospitals or other
providers without payment from the patient or a government-sponsored or
private insurance program. It includes both charity care, which is
provided without the expectation of payment, and bad debt, for which the
provider has made an unsuccessful effort to collect payment due from the
patient.
UNDERINSURED - People with public or private insurance policies
that do not cover all necessary health services, resulting in
out-of-pocket expenses that often exceed their ability to pay.
UNDERWRITING - The process by which health insurers decide
whether or not to accept an individual's application for insurance, and,
if the applicant is accepted, what conditions to apply. Underwriting is
also applied to small employers. If the insurer decides that a
particular individual or group poses greater than normal financial
risks, it might charge higher premiums, offer more limited benefits, or
refuse to pay for services relating to a particular "pre-existing"
condition.
UNIVERSAL COVERAGE - Health insurance coverage for all people,
through either public or privately funded programs.
UTILIZATION REVIEW (UR) - An insurer's review of health care
services - particularly specialist referrals, emergency room use and
hospitalizations - to evaluate their appropriateness, necessity, and
quality. The review can be performed before, during, or after care is
delivered.
V
VOUCHER - In various health reform proposals, a certificate or
fixed dollar amount that is provided to low- or moderate-income persons,
which is used to pay all or part of the cost of health insurance or
services.
3. PPACA Seeks to Simplify Health Insurance Forms and Help Consumers
Make Better Choices.
The
Patient Protection and Affordable Care Act (PPACA) calls for a new
health insurance disclosure form, called the Summary of Benefits and
Coverage, which uses a fixed layout and standard terms and definitions
to allow consumers to compare health insurance plans and understand
terms of coverage. The Consumers Union conducted a study that examined
consumers' initial reactions to a draft standard form prepared by the
Commonwealth Fund. Testing revealed that consumers were able to use the
forms to make hypothetical choices among health plans. However,
the study also found deep-seated confusion and
lack of confidence with respect to health plan cost-sharing.
These findings have significant implications for any venue providing
comparative displays of health insurance information, like the future
state exchanges, and for policies that rely on the ability of consumers
to make informed health insurance purchasing decisions, such as
"consumer-driven health care" policies.
Here is draft form that was used in the Consumers Union study:
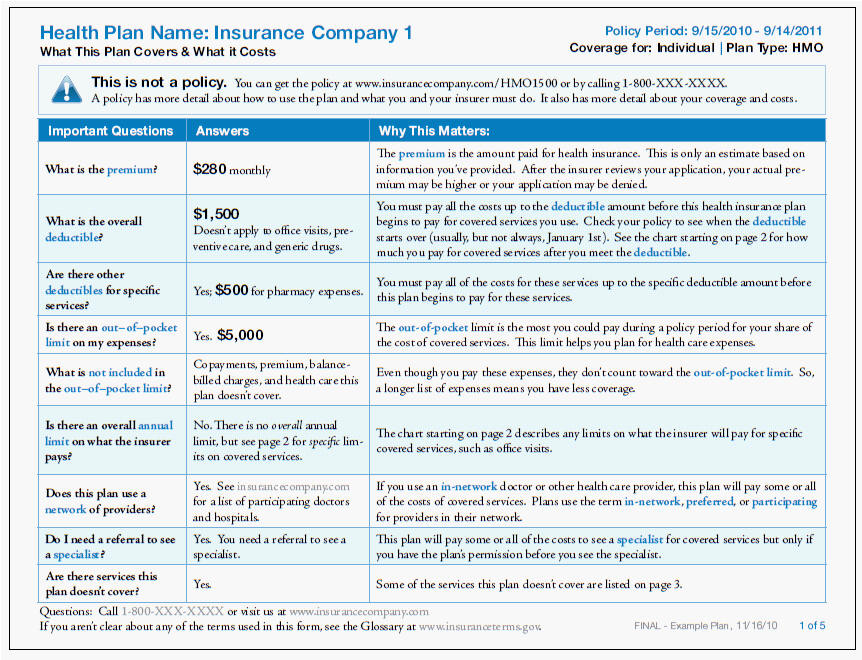
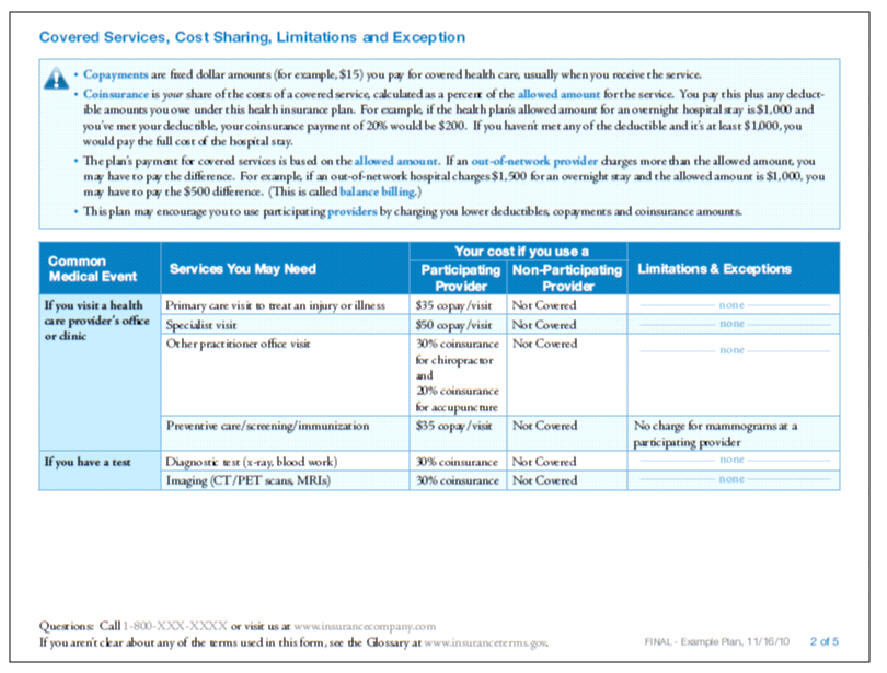
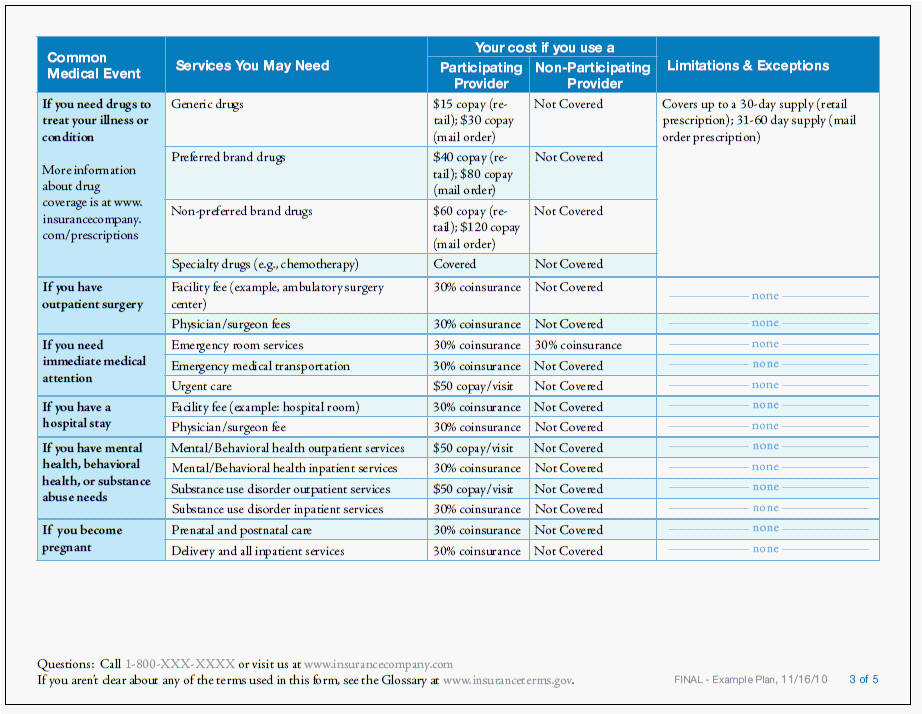
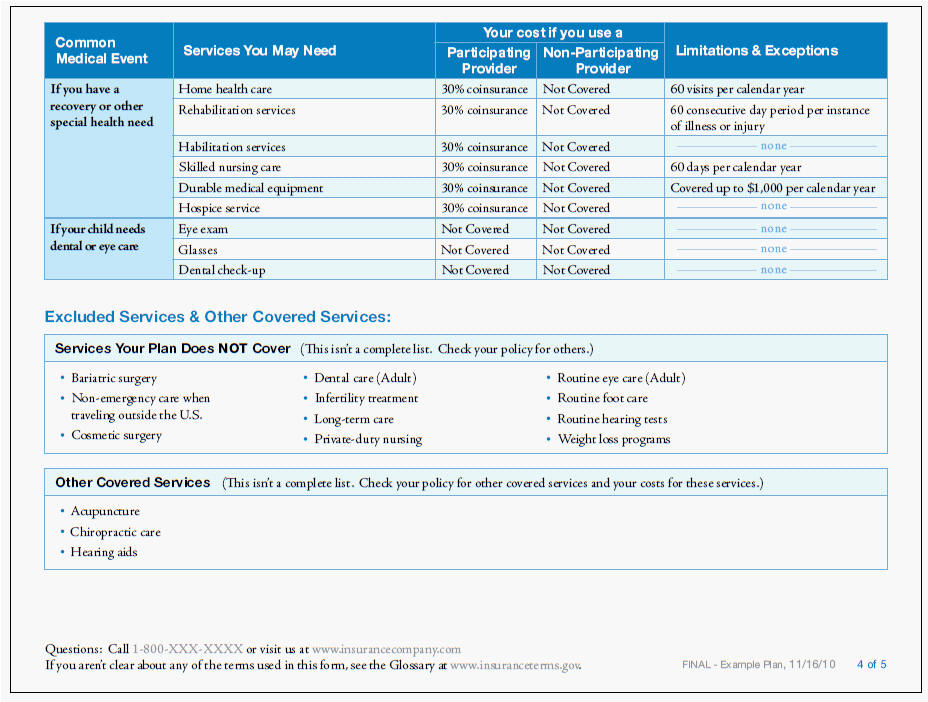
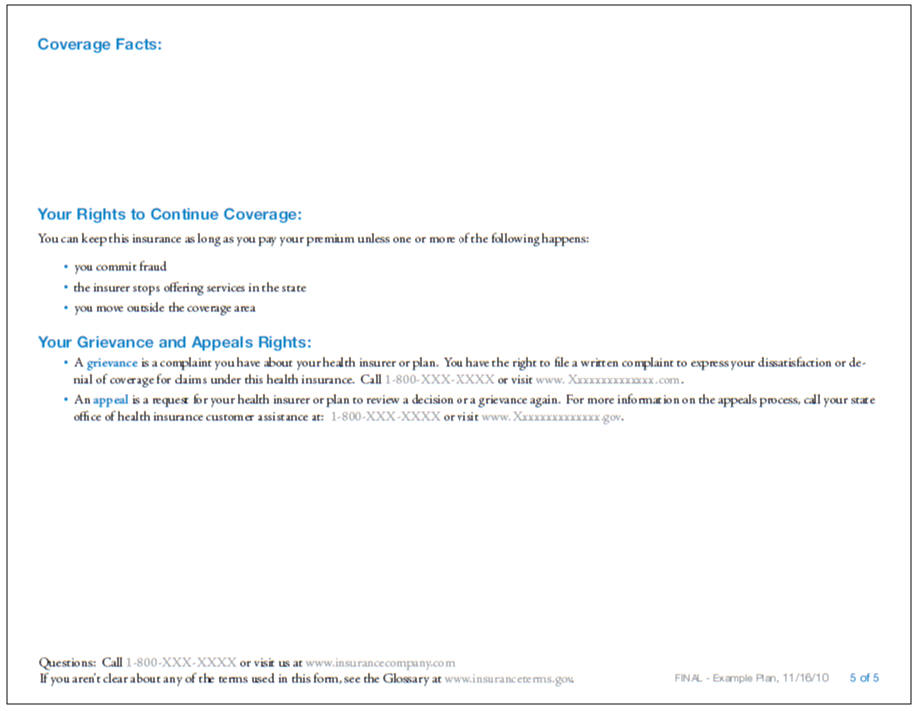
While the above form seems "simple" enough for anyone with 8 years of
university education (Jesuitical at that), it appears that many
Americans will sill have trouble understanding and making sense of
their health insurance. ... And, of course, that is exactly why the
for-profit health insurance industry is trying so hard to repeal PPACA.
Imagine if consumers actually understood what they were getting,
insurers wouldn't be able to deny as much coverage or cancel policies as
easily... and their profits might go down.
|